The sum
BMI is weight in kg ÷ (height in m)². In pounds and inches it's weight ÷ height² × 703. Keys named it the body mass index in 1972, after comparing simple weight-for-height measures in 7,424 men.
Calculator
Body mass index (BMI) is your weight in kilograms divided by your height in metres squared. Enter your height and weight in cm and kg, feet and stones, or feet and pounds to see your BMI and the range the National Institute for Health and Care Excellence (NICE) puts it in, including the lower thresholds NICE uses for people of South Asian, Chinese, other Asian, Middle Eastern, Black African or African-Caribbean background. BMI is a quick screening number for adults: it can't tell muscle from fat or show where you carry weight, so pair it with your waist-to-height ratio. It isn't for under-18s or for use during pregnancy.
Choose your units, enter your height and weight, and add your age and family background if you'd like the result to take them into account.
22.9
Your BMI is in the healthy weight range.
| Range | BMI |
|---|---|
| underweight | below 18.5 |
| healthy weightyour BMI | 18.5 to 24.9 |
| overweight | 25 to 29.9 |
| obesity class 1 | 30 to 34.9 |
| obesity class 2 | 35 to 39.9 |
| obesity class 3 | 40 or more |
At your height, a BMI of 18.5 to 24.9 is a weight of 56.7 kg to 76.3 kg. BMI can't tell muscle from fat, so it's one number among several.
BMI can't tell muscle from fat: if you're very muscular it can put you in a higher range than your body fat suggests. Check your waist-to-height ratio too, as NICE suggests when BMI is under 35.
If you have, or think you might have, an eating disorder, these numbers aren't the right tool. See a GP, or talk in confidence to Beat on 0808 801 0677 (England); Beat's helplines lists the numbers for Scotland, Wales and Northern Ireland.
BMI is weight in kg ÷ (height in m)². In pounds and inches it's weight ÷ height² × 703. Keys named it the body mass index in 1972, after comparing simple weight-for-height measures in 7,424 men.
For most adults, NICE and the World Health Organization (WHO) agree: 18.5 to 24.9 is a healthy weight, 25 to 29.9 overweight, and 30 or more obesity, in classes from 35 and 40. Under 18.5 is underweight. WHO's ranges are the same for women and men and don't change with age.
For people of South Asian, Chinese, other Asian, Middle Eastern, Black African or African-Caribbean background, NICE and the NHS treat 23 to 27.4 as overweight and 27.5 or more as obesity, because health risks start at a lower BMI. In 1.47 million adults in England, the BMI with the same diabetes risk as 30 in White adults ranged from 23.9 to 28.1.
Across 25 studies, the usual BMI cut-offs missed half the people with excess body fat. It can't tell muscle from fat, so muscular people can score high, and it can't show where you carry fat.
Across 239 studies, death rates were lowest at a BMI of 20 to 25 and rose below and above that. For one person, though, BMI adds little to heart risk once blood pressure, diabetes and cholesterol are known, and being fit cuts much of the risk linked to a higher BMI.
Not for under-18s, whose BMI is judged on growth centiles, or in pregnancy. No guideline uses different ranges for older adults, but NICE asks for caution from 65; separate low-BMI cut-offs for over-70s exist only for diagnosing malnutrition.
BMI = weight in kg ÷ (height in m)². WHO's own example is 70 kg and 1.75 m, which gives 22.9. In US units, the US Centers for Disease Control and Prevention (CDC) writes it as "weight (pounds)/[height (in)]2 x 703". The 703 is a rounding of 703.07 (our arithmetic), so the calculator converts feet, inches, stones and pounds exactly instead, and both kinds of units give the same answer.
Choose cm and kg, feet and stones, or feet and pounds. Heights from 120 to 230 cm (3 ft 11 in to 7 ft 6 in) and weights from 30 to 300 kg work (our choice). The result is shown to one decimal place, as the NHS shows it, and the range is read from the number you see, so a BMI of 24.96 shows as 25.0 and is in the overweight range.
Source 5
These are NICE's words (recommendation 1.9.10). NICE has no band below 18.5; WHO calls under 18.5 underweight. NICE adds: "Use clinical judgement when interpreting the healthy weight category because a person in this category may nevertheless have central adiposity."
NICE's recommendation 1.9.11: "People with a South Asian, Chinese, other Asian, Middle Eastern, Black African or African-Caribbean background are prone to central adiposity and their cardiometabolic risk occurs at lower BMI, so use lower BMI thresholds as a practical measure of overweight and obesity: overweight: BMI 23 kg/m2 to 27.4 kg/m2; obesity: BMI 27.5 kg/m2 or above. For people in these groups, obesity classes 2 and 3 are usually identified by reducing the thresholds highlighted in recommendation 1.9.10 by 2.5 kg/m2."
Choose that background and the calculator uses this table. The healthy weight band ends where overweight starts, and the obesity classes come from taking 2.5 off NICE's general thresholds (our arithmetic):
Source 1
Each BMI is shown to one decimal place, and its range is read from that number:
Your BMI and its range, said about the number in NICE's words: "Your BMI is in the healthy weight range". Under it is the table of ranges for the background you chose, with yours marked, and a folded box, "What the bands mean for your height". That box shows the weights at a BMI of 18.5 and 24.9 for your height (22.9 on the lower thresholds) in your units: at 170 cm, 53.5 to 72.0 kg, or about 8 st 6 lb to 11 st 5 lb (our arithmetic). It never shows a weight to lose.
Every result reminds you that BMI can't tell muscle from fat, and gives the Beat eating disorder helpline. Under 18.5 it adds when to see a GP, at 65 and over NICE's caution, and below 12 or above 90 a note to check your entries. Under 18, or if you tick that you're pregnant, it stops and says where to go instead. The next step links to the waist-to-height ratio calculator.
Adolphe Quetelet, a Belgian mathematician and statistician, described the index in 1832, having found that in adults "the weight increases as the square of the height". In 1972 Keys compared simple measures of weight for height in 7,424 men in 12 groups in five countries. Weight ÷ height² was "slightly better" than weight ÷ height at tracking body fat without tracking height, and Keys named it the body mass index, preferring it for its simple sum and its "applicability to all populations at all times".
NICE and WHO use the same ranges for most adults: healthy weight 18.5 to 24.9, overweight 25 to 29.9 and obesity from 30, in three classes. WHO says its values are "age-independent and the same for both sexes", and the CDC uses the same numbers for adults "regardless of age, sex, or race".
NICE uses 23 to 27.4 for overweight and 27.5 or more for obesity in people of South Asian, Chinese, other Asian, Middle Eastern, Black African or African-Caribbean background. In 1.47 million adults in England, the BMI with the same type 2 diabetes risk as 30 in White adults was 23.9 in South Asian, 26.6 in Arab, 26.9 in Chinese and 28.1 in Black adults.
In 25 studies of 31,968 people, the usual BMI cut-offs found only half of those with excess body fat (sensitivity 0.50, specificity 0.90). In 13,601 US adults, a BMI of 30 or more picked up 36% of men and 49% of women with high body fat. In 439 college students, a BMI of 25 or more labelled many men and female athletes overweight who weren't over-fat, while in women who didn't play sport it missed some with high body fat. NICE asks for caution with BMI in people with high muscle mass.
In 3.95 million people who had never smoked, death rates were lowest at a BMI of 20 to 25. Against 22.5 to 25, the risk was 51% higher at 15 to 18.5, 7% higher at 25 to 27.5, 45% higher at 30 to 35 and 2.76 times as high at 40 to 60. But in 221,934 people, adding BMI or waist size to blood pressure, diabetes and cholesterol didn't improve heart risk prediction, and in 20 studies fit people with overweight or obesity had no clearly higher mortality than fit people of a healthy weight. Low BMI and high body fat were each linked with higher mortality in 54,420 adults who had scans.
No guideline changes the ranges, but NICE asks for caution from 65, because health conditions, loss of muscle and the possibly protective effect of a slightly higher BMI matter more. In 197,940 adults aged 65 and over, mortality was 19% higher at a BMI of 20 to 20.9 and 12% higher at 21 to 21.9 than at 23 to 23.9, and began to rise above 33.
Under 18, BMI is compared with children of the same age and sex on growth centiles, not adult ranges. NICE classes overweight from the 91st centile, clinical obesity from the 98th and severe obesity from the 99.6th, using the Royal College of Paediatrics and Child Health (RCPCH) charts.
The NHS: "If you are from a South Asian, Chinese, other Asian, Middle Eastern, Black African or African-Caribbean background you're at risk of health problems with a slightly lower BMI, so: a BMI of 23 to 27.4 is overweight; a BMI of 27.5 or higher is obese." Its adult calculator asks about your background "because people from an Asian, Black African, African-Caribbean or Middle Eastern ethnic background have a higher chance of developing health problems at a lower BMI".
NICE's committee found that "studies in people of South Asian and Chinese family backgrounds showed an increased risk at a BMI of 21 kg/m2 to 26 kg/m2, whereas people from White family backgrounds showed increased risks at 25 kg/m2 to 29 kg/m2". For Middle Eastern (Arab and Iranian), Black African, Black Caribbean and other Asian (Japanese, Korean and Thai) family backgrounds, risk rose at values that "ranged from 21 kg/m2 to 30 kg/m2 but most were below 25 kg/m2". There was no direct evidence for obesity classes 2 and 3, so taking about 2.5 off was the committee's consensus. It also noted a lack of evidence for some ethnic groups, and few UK studies.
Source 20
In 1.47 million adults in England, followed for a median of 6.5 years, the BMI with the same type 2 diabetes risk as 30 in White adults was 23.9 in South Asian, 26.6 in Arab, 26.9 in Chinese and 28.1 in Black adults. A WHO expert consultation in 2004 found that risk in Asian populations started anywhere from 22 to 25, and named extra action points at 23.0, 27.5, 32.5 and 37.5 while keeping WHO's international ranges. For the same body fat, age and sex, BMI was 1.9 to 4.6 units lower in Chinese, Ethiopian, Indonesian and Thai groups than in Caucasian groups.
Neither NICE nor the NHS gives separate advice for mixed backgrounds (our reading), so ask your GP which ranges suit you. The waist-to-height ratio uses the same bands for every ethnic background, which makes it a useful second check.
Source 1
BMI weighs everything together. The NHS: "if you have a lot of muscle, you may be classed as overweight or obese despite having low body fat". In 13,601 US adults, BMI couldn't tell body fat from lean mass between 25 and 29.9, and it did worse with age. NICE: "Interpret BMI with caution in adults with high muscle mass because it may be a less accurate measure of central adiposity in this group."
The ranges are the same for everyone, but body fat at a given BMI isn't. WHO: "the percentage of body fat mass increases with age up to 60-65 years in both sexes, and is higher in women than in men of equivalent BMI". So the same BMI can mean more body fat for an older woman than for a young man.
NICE says to use BMI "with caution because it is not a direct measure of central adiposity", the fat around your middle, and pairs it with the waist-to-height ratio below a BMI of 35. In UK survey data on 1,453 adults, people with a healthy BMI but a ratio of 0.5 or more had worse blood fats, blood sugar and blood pressure than those with a healthy BMI and a smaller waist.
In 20 studies of 398,716 observations, unfit people had 2 to 3 times the risk of dying of fit people of a healthy weight, at any BMI, while fit people with overweight or obesity had no clearly higher risk. These studies show links, not proof, but they're a good reason to train for fitness whatever your BMI.
"Interpret BMI with caution in people aged 65 and over, taking into account comorbidities, conditions that may affect functional capacity and the possible protective effect of having a slightly higher BMI when older." NICE's committee explains that functional capacity may be reduced by "conditions such as age-related spinal disorders or sarcopenia" (loss of muscle), and that a slightly higher BMI can be protective because older people with one are "less likely to be experiencing undernutrition". Enter an age of 65 or over and the calculator adds this caution.
WHO's ranges are "age-independent", and the CDC uses them "regardless of age". Some calculators offer separate ranges for older adults, but we found no guideline that sets them. The one age-specific cut-off we found is for diagnosing malnutrition: the Global Leadership Initiative on Malnutrition (GLIM) criteria count a BMI under 20 below age 70, or under 22 from 70, as one sign (under 18.5 and 20 in Asia), and need a second sign as well.
In 32 studies of 197,940 adults aged 65 and over, mortality was 12 to 19% higher at a BMI of 20 to 21.9 than at 23 to 23.9, and began to rise above 33. In a larger analysis, the extra risk for each 5 points of BMI above 25 was smaller in people measured at 70 to 89 than at 35 to 49. These are studies of groups, not ranges for you.
The NHS says to speak to a GP if you've lost weight suddenly, if you've lost weight without changing your diet or exercise routine, or if you use the control of food to cope with feelings and other situations.
Source 22
The NHS: "It's important to use the right calculator for adults (aged 18 and over) or children and teenagers (aged between 2 and 17)." Its child calculator needs a date of birth, sex at birth and the date of measuring, and "uses the same data sources as the RCPCH (Royal College of Paediatrics and Child Health) Digital Growth Charts". Enter an age under 18 here and the calculator stops and links to it.
NICE asks for charts that are "appropriate for children and young people" and "adjusted for age and sex", and classes overweight from the 91st centile, clinical obesity from the 98th and severe obesity from the 99.6th. The RCPCH chart adds that a BMI below the 2nd centile "is unusual and may reflect undernutrition", though it can also just reflect a small build. The UK curves come from a large representative sample of British children.
International cut-offs for children were drawn from growth surveys in six countries so that "at age 18 years" they "passed through the widely used cut off points of 25 and 30". Before then, a child's BMI only makes sense against others of the same age and sex.
Source 30
The CDC uses percentiles for ages 2 through 19: underweight under the 5th, a healthy weight from the 5th to under the 85th, overweight from the 85th to under the 95th, obesity from the 95th, and severe obesity at "120% of the 95th percentile or greater, or 35 kg/m2 or greater".
Source 16
In 37 studies of 53,521 children and teenagers, the usual BMI cut-offs had a sensitivity of 0.73 and specificity of 0.93: they rarely flagged a child wrongly, but missed over a quarter of those with excess body fat.
Source 31
NICE asks professionals to "think about the vulnerability of young people to eating disorders, and the impact of measuring their weight". If you're worried about a child's weight or eating, talk to their GP, school nurse or health visitor.
Adult ranges don't apply while you're growing. Use the NHS BMI calculator for children and teenagers (ages 2 to 17) in the UK, or the CDC's child and teen calculator in the US.
The NHS calculator isn't for use in pregnancy, and the calculator stops if you tick that you're pregnant. NICE asks midwives to "measure the person's height and weight and calculate BMI at the first face-to-face antenatal appointment", and not to weigh you routinely after that without a clinical reason. Ask your midwife.
The NHS calculator isn't for you either. See a GP, or contact Beat: the support section below has the numbers.
BMI depends on height, so a growth condition or a curved spine skews it. Clinicians can estimate height from the length of your forearm, your knee height or half your arm span instead; ask your GP or a dietitian.
Missing limbs lower your weight, so a standard BMI reads low. Clinicians adjust for it: one UK guide counts a whole leg as about 15.6% of body weight and a whole arm as 4.9%. Ask your clinical team or a dietitian.
Source 34
Swelling (oedema) or fluid in the abdomen (ascites), for example with heart, kidney or liver disease, adds weight that isn't fat or muscle. Clinicians judge weight differently then, sometimes using the size of the upper arm instead.
Source 34
BMI can't tell muscle from fat. NICE's waist-to-height ratio bands can be used with high muscle mass, so use that calculator as well.
Source 1
It measures weight for height. Across 25 studies, the usual cut-offs missed half the people with excess body fat, and the NHS says BMI "cannot tell the difference between muscle and fat".
WHO's ranges are "age-independent and the same for both sexes", and the CDC uses them for adults regardless of age or sex. NICE asks for caution over 65 but gives no different ranges. What does differ is body fat at the same BMI: women carry more, and it rises with age. The only age-specific BMI cut-offs we found are for diagnosing malnutrition.
In the UK, NICE uses lower thresholds (23 and 27.5) for people of South Asian, Chinese, other Asian, Middle Eastern, Black African or African-Caribbean background. In England, BMIs with the same diabetes risk as 30 in White adults ranged from 23.9 (South Asian) to 28.1 (Black).
NICE: "a person in this category may nevertheless have central adiposity". In UK survey data, people with a healthy BMI but a waist-to-height ratio of 0.5 or more had worse risk factors than those with a smaller waist.
Neither. On average, mortality rises gradually above 25 (7% higher at 25 to 27.5, 20% higher at 27.5 to 30) and more steeply above 30. For one person, BMI adds little to heart risk prediction once blood pressure, diabetes and cholesterol are known, and fitness shifts the risk a lot.
Quetelet was a statistician describing "the average man". Keys chose the index for studies of whole populations because it was simple and could be applied "to all populations at all times".
The NHS says to use "the right calculator for adults (aged 18 and over) or children and teenagers (aged between 2 and 17)", and NICE asks for charts adjusted for age and sex.
If you have, or think you might have, an eating disorder, these numbers aren't the right tool: the NHS calculators say the same. Eating disorders can affect people at any weight. See a GP as soon as you can, or talk in confidence to the eating disorder charity Beat: 0808 801 0677 (England), 0808 801 0432 (Scotland), 0808 801 0433 (Wales) or 0808 801 0434 (Northern Ireland), or email help@beateatingdisorders.org.uk (Scotland, Wales and Northern Ireland have their own addresses on Beat's website, along with opening times). If you or someone else is in immediate danger, call 999 or Samaritans on 116 123; for medical advice, call 111.
The NHS lists these among the signs of an eating disorder:
Source 35
If numbers like these make you anxious, set goals for health and strength instead, such as walking further or lifting a little more (our suggestion, as in our exercise for weight loss guide).
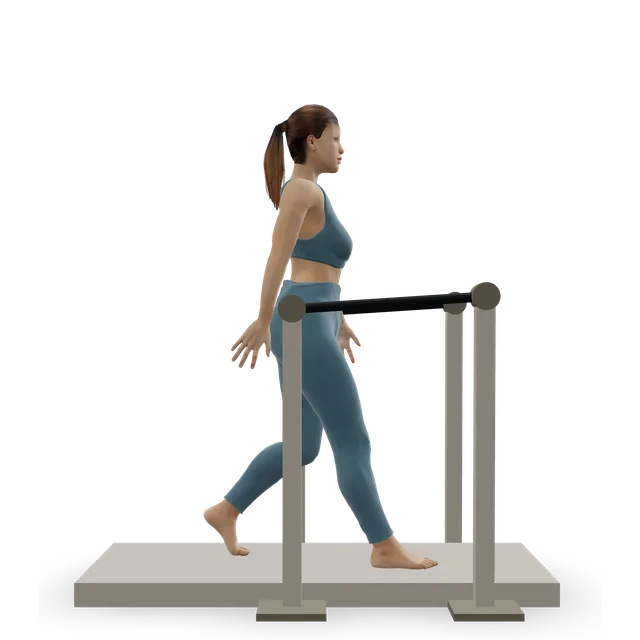
Ways to move more, whatever your BMI: a short walk after meals, steady cardio and two strength sessions a week. The beginner home workout and the chair workout suit anyone starting gently or who can't stand for long.
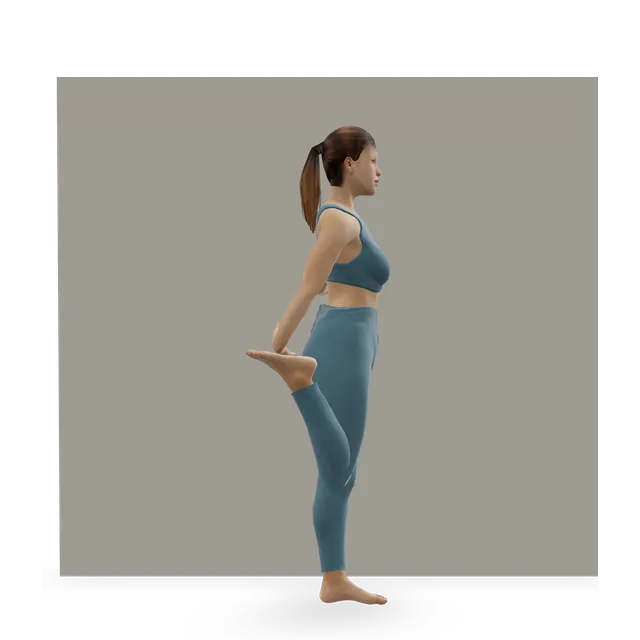
A 10-minute routine for straight after a meal: an easy walk, a few simple standing moves from blood sugar trials, then a short walk to finish.
10 minBeginner6 movesCardio machine, A bench or boxA steady 30 to 45 minute cardio session at talk-but-not-sing pace: walk, cycle, row or cross-train, counting toward weekly activity guidelines.
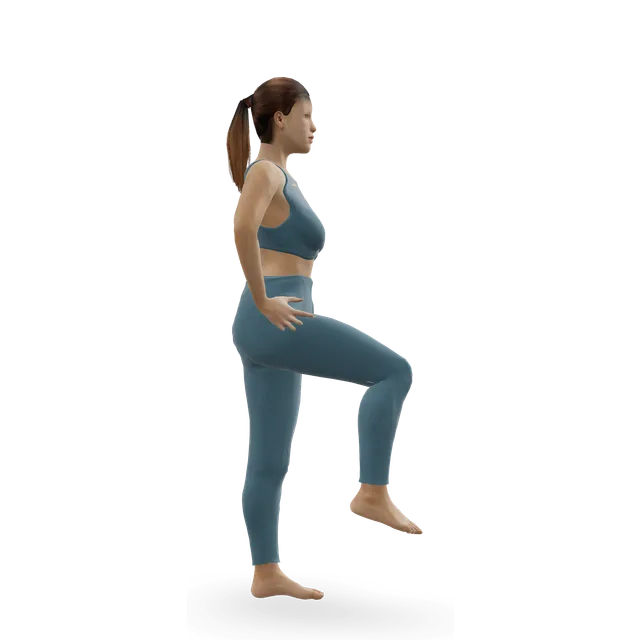
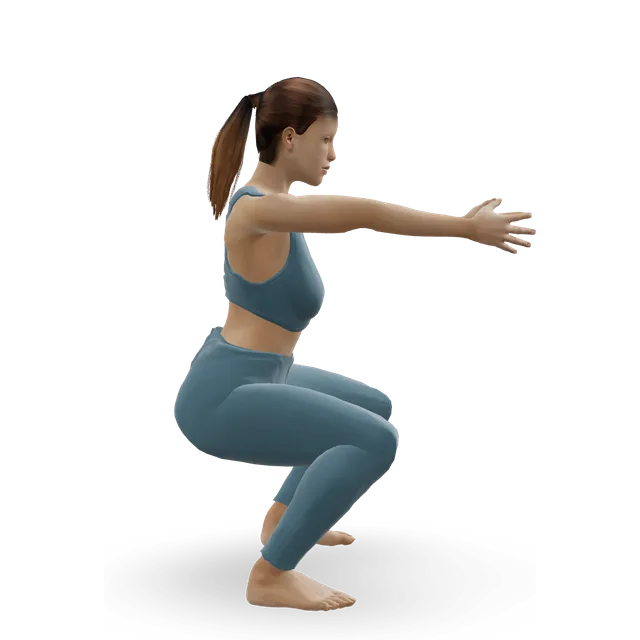
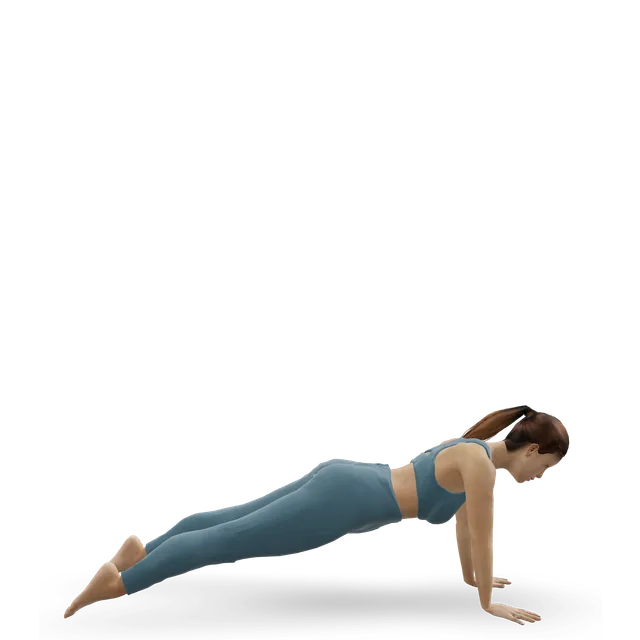
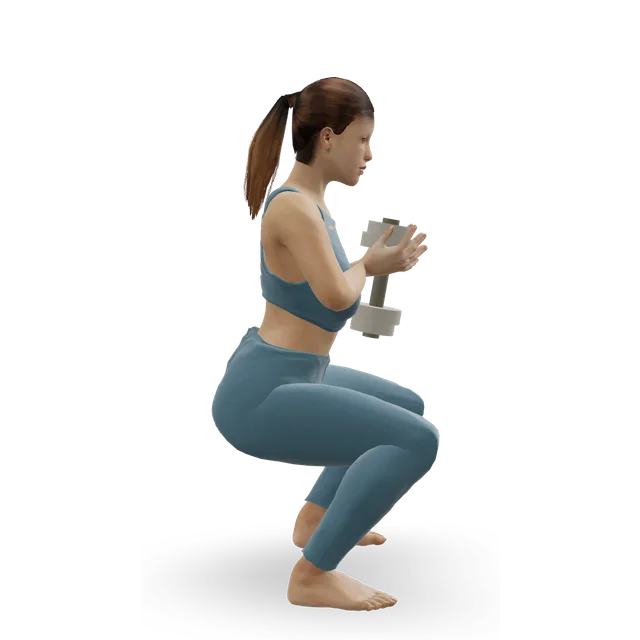
40 minBeginner3 movesCardio machine, A wallA 20-minute full-body dumbbell workout: two supersets of squats, rows, Romanian deadlifts and push-ups. Twice a week covers the minimum dose.
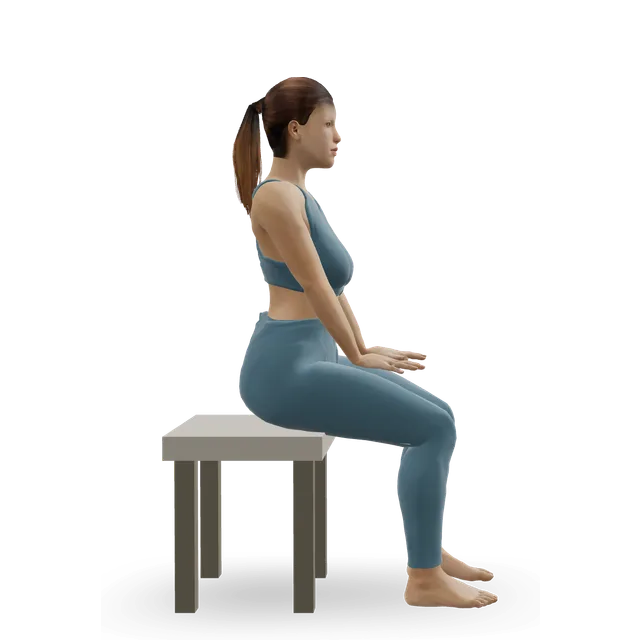
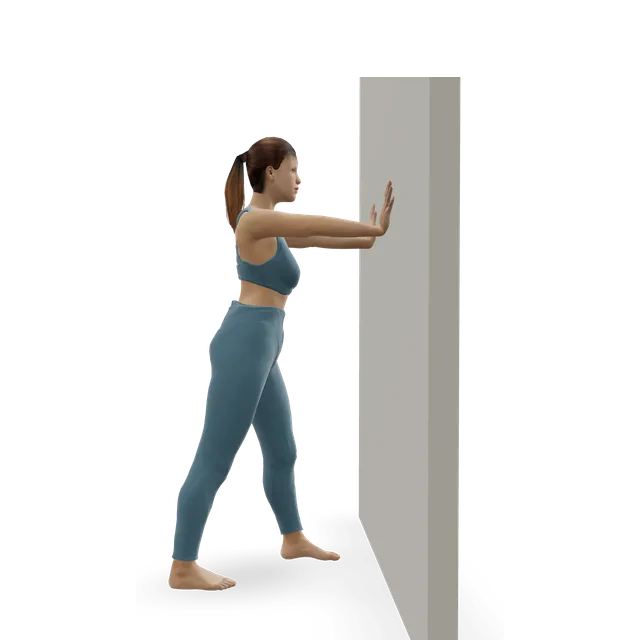
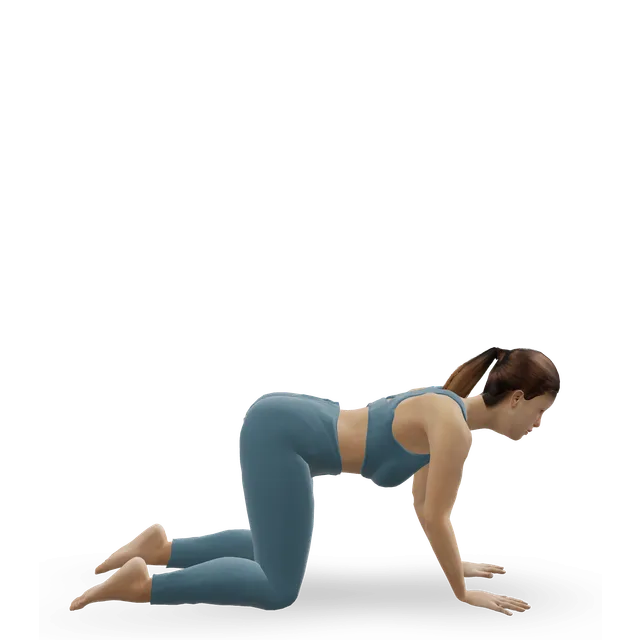
20 minBeginner8 movesA dumbbell, A bench or boxA gentle 20-minute beginner home workout with a chair, a wall and a band: sit-to-stands, wall push-ups, band rows, step-ups and dead bugs.
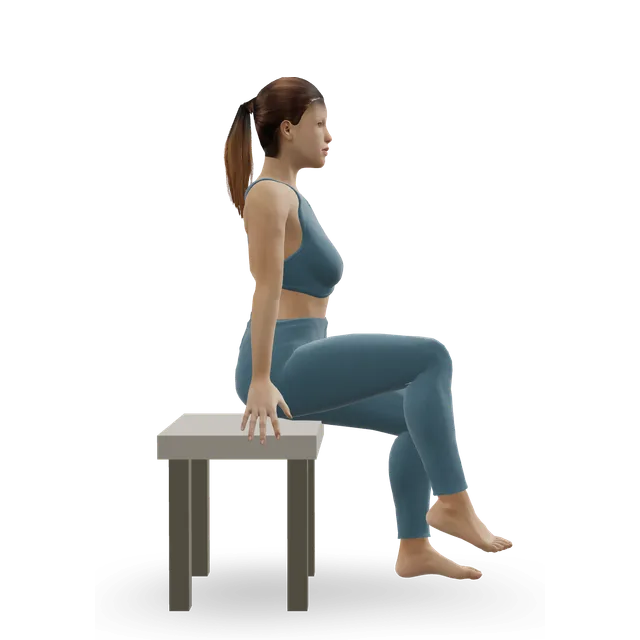
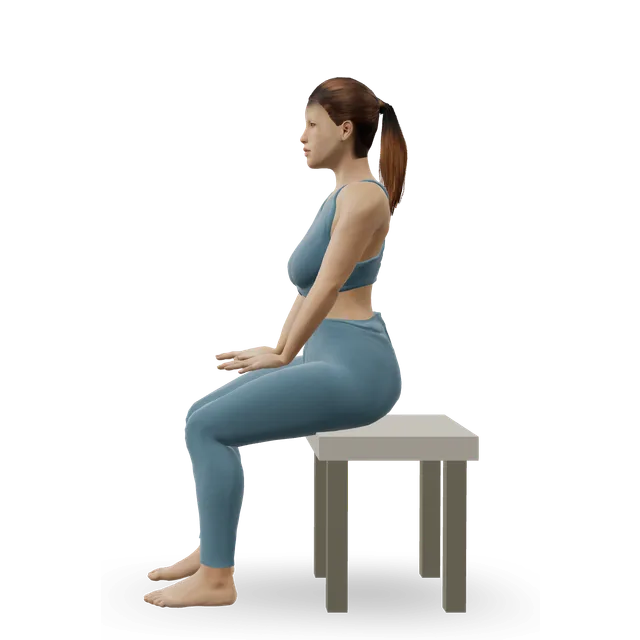
20 minBeginner11 movesA bench or box, A wallA 20-minute seated workout for older adults who cannot stand for long: marching, leg and arm strength, posture, and sit-to-stands that lead back to standing.
20 minBeginner11 movesA bench or box, Something with weightDivide your weight in kilograms by your height in metres squared: 70 kg and 1.75 m give 70 ÷ 3.0625, a BMI of 22.9. In pounds and inches, multiply your weight by 703 and divide by your height in inches squared. The calculator converts feet, stones and pounds for you and shows the result to one decimal place.
For most adults, NICE and WHO call 18.5 to 24.9 a healthy weight. For people of South Asian, Chinese, other Asian, Middle Eastern, Black African or African-Caribbean background, NICE treats 23 and over as overweight. NICE also notes that someone in the healthy range can still carry too much fat around the middle.
People from these backgrounds tend to carry more fat around the middle and develop type 2 diabetes and heart disease at a lower BMI. In 1.47 million adults in England, the BMI with the same diabetes risk as 30 in White adults was 23.9 in South Asian, 26.6 in Arab, 26.9 in Chinese and 28.1 in Black adults. Choose your family background in the calculator to see NICE's lower ranges.
For adults, the ranges are the same at every age and for both sexes. But at the same BMI, women tend to carry more body fat than men, and body fat rises with age to about 60 to 65. That's one reason BMI is only a rough guide.
No guideline uses different ranges, but NICE asks doctors to interpret BMI with caution from 65, allowing for health conditions, loss of muscle and the possibly protective effect of a slightly higher BMI. In studies of over-65s, mortality was higher at a BMI of 20 to 22 than at 23 to 24. If you're losing weight without trying, see a GP.
Not very: BMI can't tell muscle from fat, so muscular people can land in the overweight range with little body fat. NICE suggests the waist-to-height ratio as well, and its bands can be used with high muscle mass.
No. Under 18, BMI is compared with children of the same age and sex on growth centiles, so the calculator stops if you enter an age under 18. In the UK, use the NHS BMI calculator for children and teenagers; in the US, the CDC's child and teen calculator.
It's in the underweight range. See a GP if you've lost weight suddenly or without trying, or if you use control of food to cope with feelings. If you're worried about your eating, you can also call the eating disorder charity Beat on 0808 801 0677.
It's a quick, useful screen for groups of people, but a blunt one for individuals. It misses where you carry fat, how much is muscle and how fit you are, which is why NICE pairs it with the waist-to-height ratio when BMI is under 35.
Quetelet found in the 1830s that adults' weight rises roughly with the square of their height. In 1972 Keys compared simple measures in 7,424 men, found weight ÷ height² tracked body fat a little better than weight ÷ height without tracking height, and named it the body mass index.
Estimates for healthy adults, not a personal prescription or a diagnosis, and clinical review of these pages is pending. Check with a GP before hard training or testing a maximum if you have a heart condition, high blood pressure, chest pain, dizziness or breathlessness when active, and stop for sharp or increasing pain. Health disclaimer.