Keep your waist to less than half your height
That's NICE's advice, and it's the same for women and men of every ethnic background. Divide your waist by your height in the same units: under 0.5 is the aim.
Source 1
Calculator
Your waist-to-height ratio is your waist measurement divided by your height, in the same units. The National Institute for Health and Care Excellence (NICE) advises keeping your waist to less than half your height: a ratio of 0.5 to 0.59 means increased health risks, and 0.6 or more further increased health risks. Measure your waist midway between your lowest rib and the top of your hip bone after breathing out naturally, then enter it with your height. NICE's bands apply to adults of both sexes and all ethnic backgrounds, including people with a lot of muscle, if their body mass index (BMI) is under 35.
Measure your waist as the hint shows, then enter it and your height in cm, or in inches with your height in feet and inches.
0.46
NICE's band: healthy central adiposity: waist-to-height ratio 0.4 to 0.49, indicating no increased health risks.
NICE: these classifications can be used for people with a BMI under 35 of both sexes and all ethnicities, including adults with high muscle mass. Half your height is 87.5 cm (34.5 in).
| Group | Men | Women |
|---|---|---|
| Europid | 94 cm or more | 80 cm or more |
| South Asian, Chinese and Japanese | 90 cm or more | 80 cm or more |
| South and Central American | as South Asian | as South Asian |
| Sub-Saharan African, Eastern Mediterranean and Middle Eastern (Arab) | as Europid | as Europid |
US practice often uses 102 cm for men and 88 cm for women. WHO says the 94 and 102 cm figures often credited to it were only ever an example. Your waist is 80 cm.
If you have, or think you might have, an eating disorder, these numbers aren't the right tool. See a GP, or talk in confidence to Beat on 0808 801 0677 (England); Beat's helplines lists the numbers for Scotland, Wales and Northern Ireland.
That's NICE's advice, and it's the same for women and men of every ethnic background. Divide your waist by your height in the same units: under 0.5 is the aim.
Source 1
0.4 to 0.49 is healthy central adiposity, 0.5 to 0.59 increased and 0.6 or more high, for adults with a BMI under 35, including people with a lot of muscle. Since January 2026 NICE has used the same bands for children aged 5 and over.
Midway between the bottom of your ribs and the top of your hip bone, which is usually just above your belly button. Breathe out naturally and don't hold your tummy in.
Across large reviews it picked out people with high blood pressure, diabetes and heart risk slightly better than BMI. For future diabetes it was no better than waist size alone; its advantage is one cut-off for everyone.
The International Diabetes Federation (IDF) uses 94 cm for Europid men and 80 cm for women, and 90 cm for South Asian, Chinese and Japanese men. The World Health Organization (WHO) says the figures often credited to it were only ever an example.
At that BMI the ratio is almost always high, so NICE doesn't use it. The NHS calculator also leaves out under-5s, pregnancy, eating disorders and conditions that affect height.
Waist-to-height ratio = waist ÷ height, both in the same units. NICE's own instructions: "Measure waist circumference and height in the same units (either both in centimetres, or both in inches). If you know your height in feet and inches, convert it to inches (for example, 5 feet 7 inches is 67 inches). Divide waist measurement by height measurement." Enter cm, or inches with your height in feet and inches, and the calculator does the conversion. Waists from 40 to 200 cm work (our choice).
Source 1
Quoted from NICE (recommendation 1.9.14). "These classifications can be used for people with a BMI under 35 kg/m2 of both sexes and all ethnicities, including adults with high muscle mass. The health risks associated with higher levels of central adiposity include type 2 diabetes, hypertension and cardiovascular disease." NICE gives no band below 0.4. Since January 2026 it has used the same bands for children and young people aged 5 and over.
NICE: "Find the bottom of the ribs and the top of the hips. Wrap a tape measure around the waist midway between these points (this will be just above the belly button) and breathe out naturally before taking the measurement."
The NHS calculator puts it as: "On the side of your body, feel for your lowest rib and the top of your hip bone. Find the middle point between them. This will be roughly level with your belly button. Wrap the tape measure around this point. Breathe out naturally, do not hold your tummy in and take your measurement."
WHO adds detail for researchers: a tape that doesn't stretch, standing with "feet close together, arms at the side", measuring "at the end of a normal expiration", and taking two readings, averaged if they're within 1 cm. Measure over skin or thin clothing and keep the tape level all the way round. Different sites give different readings, so use the same one each time: trousers usually sit lower than this (our reading).
Each ratio is shown to two decimal places, and its band is read from that number:
Source 1
Your ratio to two decimal places and NICE's band, quoted exactly, with NICE's note on who the bands apply to. It also shows half your height: for 170 cm, "Half your height is 85 cm (33.5 in)" (our arithmetic). At 0.5 or more, it adds NICE's advice to "seek advice and further clinical assessments (such as a cardiometabolic risk factor assessment) from a healthcare professional". Below 0.4 it says "NICE doesn't classify a ratio below 0.4", with when to see a GP and where to get support.
Tick "My BMI is 35 or more" and it explains why NICE doesn't use the ratio then, and shows no band. Under 18, or if you tick that you're pregnant, it stops and says where to go instead. A folded box, "Your waist alone", shows the IDF's waist cut-offs for comparison, with WHO's note that the commonly quoted figures were an example. Every result gives the Beat eating disorder helpline.
NICE classes 0.4 to 0.49 as healthy, 0.5 to 0.59 as increased risk and 0.6 or more as further increased risk, for adults with a BMI under 35 of any sex or ethnic background, and since January 2026 for children aged 5 and over. Its committee found the best cut-off in individual studies "was generally around 0.5 for all ethnicities and sexes".
NICE, the NHS and WHO all measure midway between the lowest rib and the top of the hip bone, after breathing out naturally. WHO adds a non-stretch tape and two readings within 1 cm.
In 78 studies the mean area under the curve, a measure of how well a test sorts people with and without a condition, was 0.704 for the waist-to-height ratio, 0.693 for waist size and 0.671 for BMI. A meta-analysis of over 300,000 adults found the ratio significantly better than both, and in UK data it found raised risk in some people with a healthy BMI. The gains are real but small.
For future type 2 diabetes, the ratio was as strong as waist size, but measuring height as well as the waist "appeared to have no additional benefit". Another meta-analysis found it better than waist size. NICE's committee chose it because "the classification is the same for all ethnicities and sexes".
The IDF uses 94 cm (men) and 80 cm (women) for Europid adults and 90 cm and 80 cm for South Asian, Chinese and Japanese adults, and US practice uses 102 cm and 88 cm. WHO says the 94 and 102 cm figures often credited to it were "an example only and not WHO recommendations".
NICE doesn't use it above a BMI of 35. In 221,934 people, no body measure, waist size included, improved heart risk prediction once blood pressure, diabetes and cholesterol were known. In children, the best cut-off varied by region, from 0.46 in East and Southeast Asia to 0.54 in Latin America.
In 10 studies, "BMI was the poorest discriminator", and the waist-to-height ratio was the best for high blood pressure, diabetes and raised blood fats in both sexes, with areas under the curve of 0.67 to 0.76. In 78 studies, the averages were 0.704 for the ratio, 0.693 for waist size and 0.671 for BMI. In 31 papers with over 300,000 adults, waist size improved on BMI by 3% and the ratio by 4 to 5%.
In 15 studies with 6,472 people who developed type 2 diabetes, the risk for each step up was 1.62 times for the ratio, 1.63 for waist size and 1.55 for BMI: the ratio beat BMI but not waist size. Its practical advantage is one cut-off for everyone, which NICE calls "a key benefit".
In 1,453 adults in the UK's National Diet and Nutrition Survey, 35% of people judged at no increased risk by the older BMI-and-waist matrix had a ratio of 0.5 or more. Those with a healthy BMI and a ratio of 0.5 or more had "some significantly higher cardiometabolic risk factors".
Source 11
In 72 cohort studies of 2.5 million people, each 0.1 higher ratio went with a 24% higher risk of death, in a nearly J-shaped curve, after allowing for BMI. In 20 cohorts, people in the highest category had 23% higher mortality overall and 39% higher from heart and circulation disease than those in the lowest.
In 17 studies of 74,520 older adults, the ratio picked out metabolic syndrome a little better than BMI or waist size, and about as well for its parts, such as high blood pressure. The authors say more studies in older adults are needed to set cut-offs.
Source 17
NICE found the best cut-offs in children "ranged from 0.42 to 0.57, with most studies averaging around 0.5", and judged the evidence "not as good as the evidence for adults". In 41 studies of 138,561 children and adolescents, the best cut-off varied by region, and the authors concluded that a single cut-off "may be inappropriate". Against scans, neither BMI nor the ratio was clearly better in children.
In 58 studies of 221,934 people, adding BMI, waist size or waist-to-hip ratio to blood pressure, diabetes and cholesterol didn't improve heart risk prediction. The ratio is a quick screen, not a risk score.
Source 13
In 2008, a WHO consultation found "insufficient data" to prioritise the ratio. Since then, the European Association for the Study of Obesity has chosen it over waist size "due to its superiority as a cardiometabolic disease risk marker", and a 2025 Lancet commission asks for BMI to be confirmed with a waist measure or a direct fat measurement.
The IDF's 2006 cut-offs for waist size, set for screening for metabolic syndrome. They are "pragmatic cut-points taken from various different data sources", specific to ethnic group, not country of residence. A 2009 joint statement kept separate waist cut-offs: "In the interim, national or regional cut points for waist circumference can be used."
The figures most often quoted as WHO's (94 and 102 cm for men, 80 and 88 cm for women) came from a table in a 2000 WHO report, based on 2,183 men and 2,698 women aged 20 to 59 in the Netherlands, and labelled "an example only". WHO's 2008 consultation says the cut-offs "often attributed to WHO" were "an example only and not WHO recommendations".
An earlier version of the IDF criteria gave Japanese values of 85 cm for men and 90 cm for women, and a 2012 review still reprints them. The IDF's 2006 document uses 90 cm and 80 cm, noting that "Originally different values were proposed for Japanese people but new data support the use of the values shown above". The calculator's box follows the 2006 document.
NICE gives no cut-offs for waist size alone: it classes the fat around your middle by the waist-to-height ratio, and the NHS says "You should try to keep your waist size to less than half your height". WHO's consultation notes that a US obesity guide suggests waist cut-offs are only useful up to a BMI of 35, above which most people exceed them.
Cut-offs often credited to WHO class a waist-to-hip ratio of 0.90 or more (men) and 0.85 or more (women) as substantially increased risk. WHO favours waist size over waist-to-hip ratio "due to the relative ease of obtaining" it, so this calculator doesn't work it out.
Source 8
NICE uses the same bands for children aged 5 and over, but found no evidence on children measuring themselves. Enter an age under 18 and the calculator stops and points to the NHS waist-to-height ratio calculator for 5 to 17-year-olds, which is used with a parent or carer after checking the child's BMI on the NHS child BMI calculator. Under 5, the ratio isn't used: ask a health visitor or GP.
NICE: "because people with a BMI over 35 kg/m2 are always likely to have a high waist-to-height ratio", it may not add anything useful. Tick the box and the calculator explains this without showing a band; your BMI and a GP's check are the better guide.
The NHS calculator isn't for use in pregnancy, and this one stops if you tick that you're pregnant. Ask your midwife instead.
Source 10
The NHS calculator isn't for you either. See a GP, or contact Beat: the support section below has the numbers.
The NHS calculator also leaves out anyone with a growth disorder or another condition that affects height. Ask your GP.
Source 10
Fluid in the abdomen (ascites) changes weight and girth for reasons that have nothing to do with fat, and a stoma or a recent operation can do the same to a waist measurement (our reading). Ask your care team.
Source 28
WHO's 2008 consultation says those figures, "often attributed to WHO", were "an example only and not WHO recommendations", drawn from a Dutch sample. The IDF uses them as Europid cut-offs for metabolic syndrome, with lower ones for some groups.
NICE applies the same bands to people "of both sexes and all ethnicities, including adults with high muscle mass", if their BMI is under 35. Its committee did note a lack of evidence for some ethnic groups, and few UK studies.
It sorts risk slightly better than BMI (areas under the curve of about 0.70 against 0.67), but for future diabetes it's no better than waist size, and no body measure improves heart risk prediction once other risk factors are known.
Since January 2026 NICE has used the same bands from age 5. The evidence is weaker than in adults, and the best cut-off varies between regions, so children should be measured with a parent or carer using the NHS calculator.
NICE's site is midway between the bottom of your ribs and the top of your hips, "just above the belly button". Readings at different sites differ, and trousers usually sit lower (our reading).
Exercising one area doesn't burn the fat over it. Whole-body activity and eating less trim the waist; our exercise for weight loss guide covers the trials.
If you have, or think you might have, an eating disorder, these numbers aren't the right tool: the NHS calculators say the same. Eating disorders can affect people at any weight. See a GP as soon as you can, or talk in confidence to the eating disorder charity Beat: 0808 801 0677 (England), 0808 801 0432 (Scotland), 0808 801 0433 (Wales) or 0808 801 0434 (Northern Ireland), or email help@beateatingdisorders.org.uk (Scotland, Wales and Northern Ireland have their own addresses on Beat's website, along with opening times). If you or someone else is in immediate danger, call 999 or Samaritans on 116 123; for medical advice, call 111.
The NHS lists these among the signs of an eating disorder:
Source 31
The NHS says to speak to a GP if you've lost weight suddenly, if you've lost weight without changing your diet or exercise routine, or if you use the control of food to cope with feelings and other situations.
Source 27
If numbers like these make you anxious, set goals for health and strength instead, such as walking further or lifting a little more (our suggestion, as in our exercise for weight loss guide).
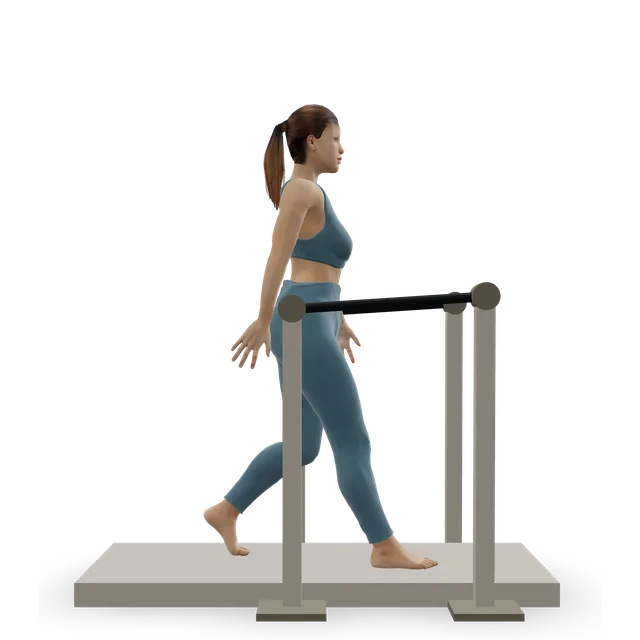
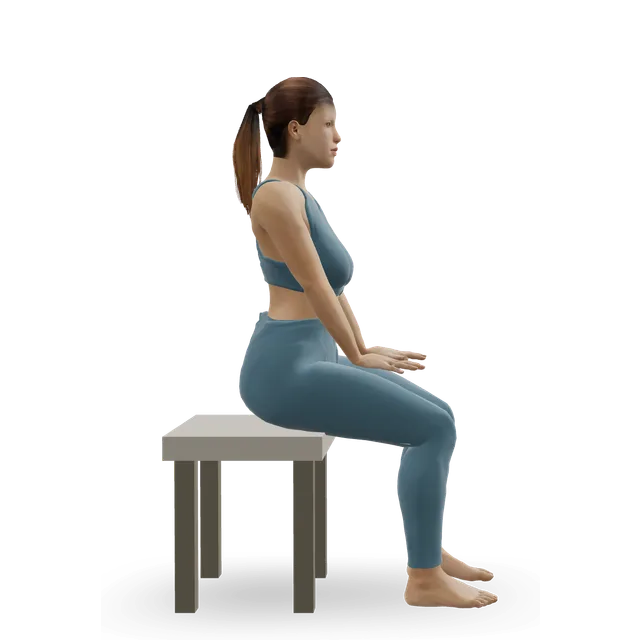
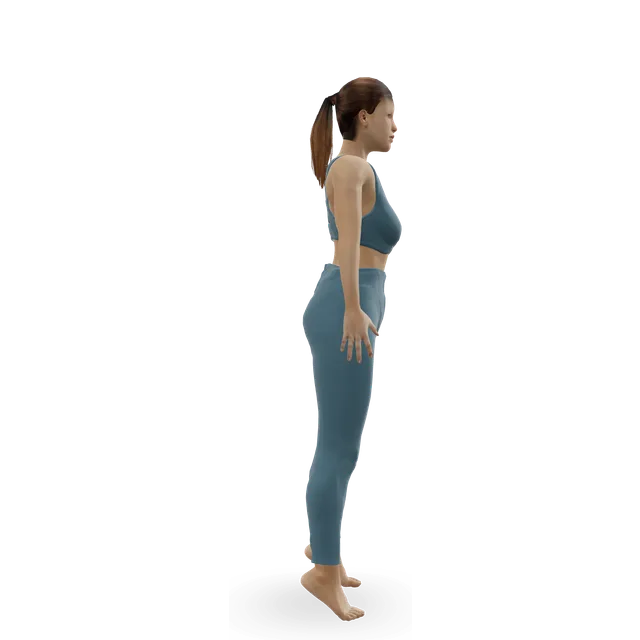
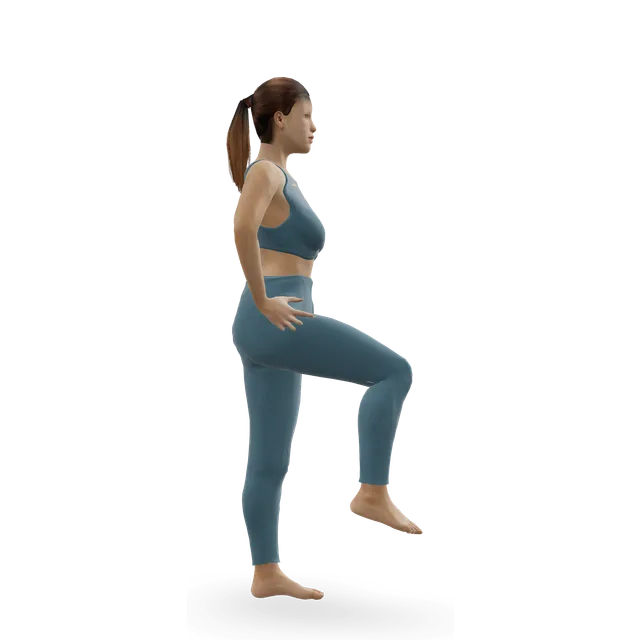
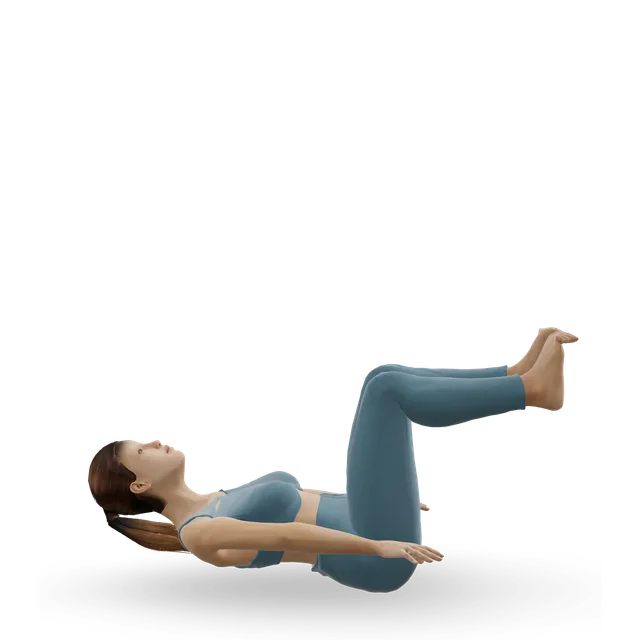
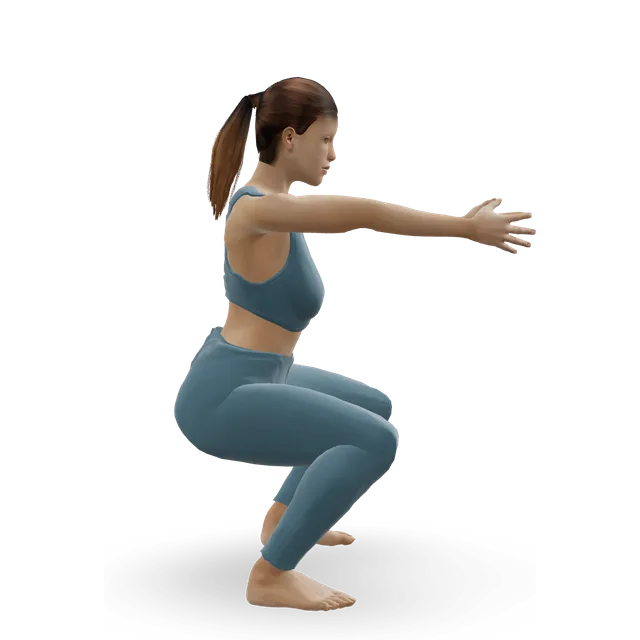
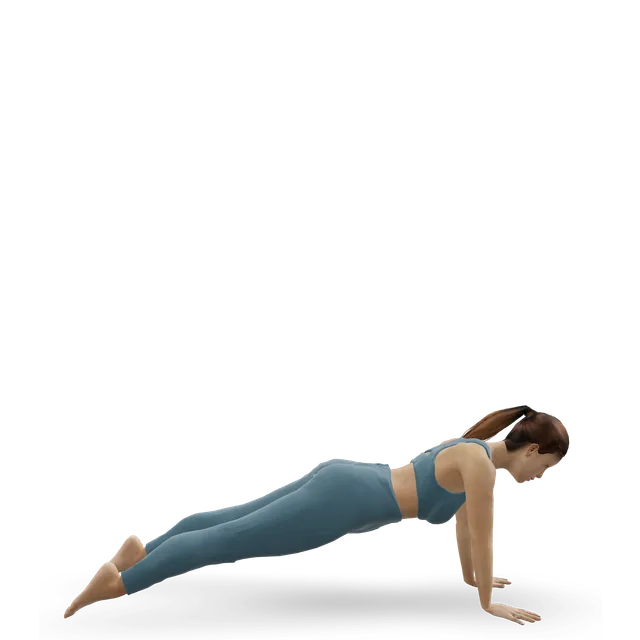
Whole-body activity trims the waist: these mix walking and steady cardio with strength work. The low-impact circuit has no jumping and a seated option for most moves.
A 10-minute routine for straight after a meal: an easy walk, a few simple standing moves from blood sugar trials, then a short walk to finish.
10 minBeginner6 movesCardio machine, A bench or boxA steady 30 to 45 minute cardio session at talk-but-not-sing pace: walk, cycle, row or cross-train, counting toward weekly activity guidelines.
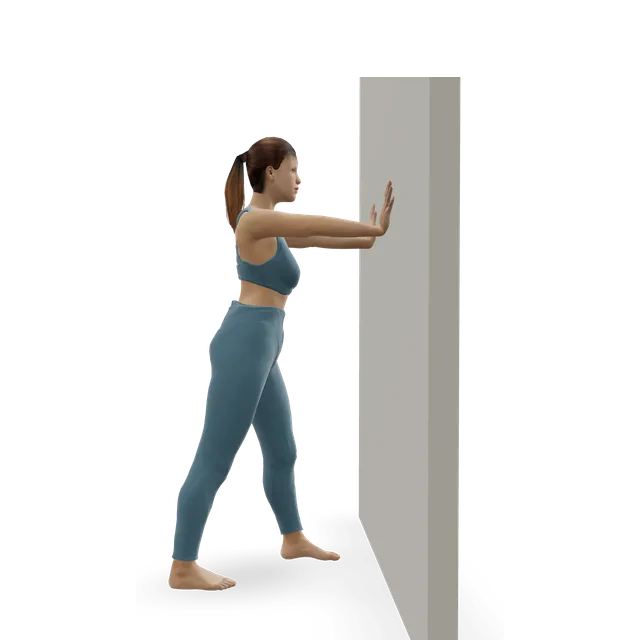
40 minBeginner3 movesCardio machine, A wallA 25-minute standing cardio circuit with no jumping: marching, step jacks, sit-to-stands, punches, step-ups and wall push-ups, with a seated option for most moves.
25 minBeginner9 movesA bench or box, A stepA 45-minute session for weight loss and health: a 20-minute brisk walk, which does more for the scales, then a short-rest Pilates circuit for strength.
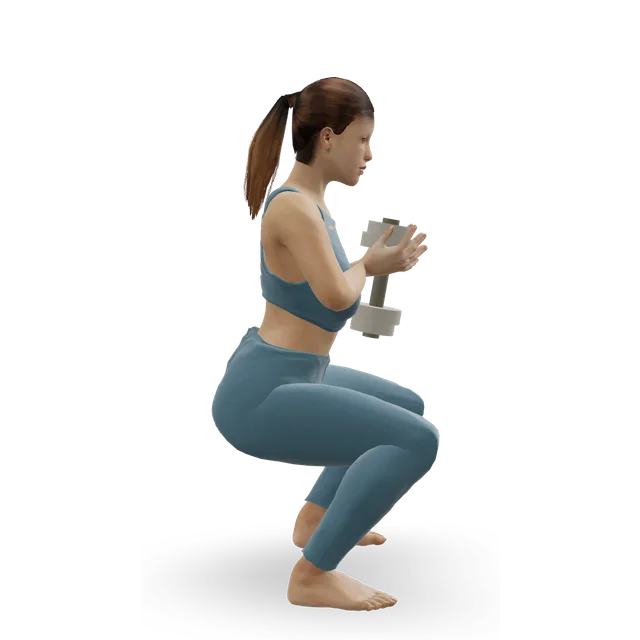
45 minBeginner11 movesCardio machineA 20-minute full-body dumbbell workout: two supersets of squats, rows, Romanian deadlifts and push-ups. Twice a week covers the minimum dose.
20 minBeginner8 movesA dumbbell, A bench or boxUnder 0.5: NICE's advice is to keep your waist to less than half your height. NICE calls 0.4 to 0.49 healthy, 0.5 to 0.59 increased risk, and 0.6 or more further increased risk of type 2 diabetes, high blood pressure and heart disease.
Find the bottom of your ribs and the top of your hip bone, and wrap the tape around your middle halfway between them, which is usually just above your belly button. Breathe out naturally, don't hold your tummy in, and keep the tape level all the way round.
Less than half your height: under 85 cm if you're 170 cm tall, or under 35 inches at 5 ft 10 in. That works for women and men of any background, if your BMI is under 35. The calculator shows half your height under your result.
A little, for spotting risk. In large reviews it picked out high blood pressure, diabetes and heart risk slightly better than BMI, and in UK data it found raised risk in some people with a healthy BMI. NICE uses both when BMI is under 35.
For future type 2 diabetes it was as good as waist size but no better. Its practical advantage is one cut-off for everyone, whereas waist cut-offs differ for women, men and ethnic groups.
NICE uses it for adults of both sexes and all ethnic backgrounds, including people with a lot of muscle, if their BMI is under 35. NICE noted that evidence for some ethnic groups, and from the UK, is thinner.
At that BMI the ratio is almost always above 0.5, so it adds little. Tick "My BMI is 35 or more" and the calculator explains this instead of showing a band; your BMI and a GP's check are the better guide.
Since January 2026 NICE has used the same bands from age 5. This calculator is for adults, so for 5 to 17-year-olds use the NHS waist-to-height ratio calculator, with a parent or carer, after checking the child's BMI.
The IDF uses 94 cm or more for Europid men and 80 cm for women, and 90 cm for South Asian, Chinese and Japanese men. US doctors often use 102 cm and 88 cm. WHO says the commonly quoted 94 and 102 cm figures were only an example.
Whole-body activity and eating less trim the waist, and our exercise for weight loss guide covers the trials, including why sit-ups don't burn belly fat. Measure every few weeks at the same site and time of day.
Estimates for healthy adults, not a personal prescription or a diagnosis, and clinical review of these pages is pending. Check with a GP before hard training or testing a maximum if you have a heart condition, high blood pressure, chest pain, dizziness or breathlessness when active, and stop for sharp or increasing pain. Health disclaimer.