Ideal weight calculator: a healthy weight range for your height
Enter your height, and this calculator shows the healthy weight range for it, the same range our body mass index (BMI) calculator and the NHS use, alongside what the four classic "ideal weight" formulas say. Most of those formulas were made to work out medicine doses, two of them from 1959 and 1983 US life-insurance tables, and they disagree with each other by several kilos, so we show them for interest, not as a goal. It doesn't ask your weight.
Enter your height in centimetres or feet and inches. You can add your sex, for the formulas, your age and your family background, and tick a box if you're pregnant.
A healthy weight for your height
53.5kg to 72kg
A body mass index (BMI) of 18.5 to 24.9, the range NICE and the NHS call a healthy weight.
A weight anywhere in this range can be healthy, and so can some weights outside it. If your GP has suggested losing weight, the NHS says losing 5 to 10% of your weight can improve your health: you don't need to reach a particular number.
What the "ideal weight" formulas say
Formula
Women
Men
Devine (1974)Doses of the antibiotic gentamicin; still used to set ventilators
61.4 kgBMI 21.3
65.9 kgBMI 22.8
Robinson (1983)Medicine doses, from 1959 US life-insurance tables
60.1 kgBMI 20.8
64.5 kgBMI 22.3
Miller (1983)Medicine doses, from 1983 US life-insurance tables
62.5 kgBMI 21.6
66 kgBMI 22.8
Hamwi (1964)A 1964 American Diabetes Association text on diet therapy
61.1 kgBMI 21.1
66.9 kgBMI 23.2
For your height, the four formulas differ by 2.4 kg (women) and 2.5 kg (men). They date from 1964 to 1983, and most were made to work out medicine doses, partly from US life-insurance tables, so they're not a health target. Robinson's is shown as published (51.65 kg + 1.85 kg per inch over 5 ft for men, 48.67 + 1.65 for women); many calculators use a rounded 52 + 1.9 and 49 + 1.7. Devine, Miller and Hamwi are as a 2016 analysis by Peterson and colleagues reprints them, and Hamwi's works in pounds.
BMI can't tell muscle from fat, and two people of the same weight can have different health. Your waist and your fitness tell you more: check your waist-to-height ratio, or work out your BMI with the BMI calculator.
If you need an ideal body weight for a medicine dose or a ventilator, your clinical team works it out; this page isn't for dosing.
If you have, or think you might have, an eating disorder, these numbers aren't the right tool. See a GP, or talk in confidence to Beat on 0808 801 0677 (England); Beat's helplines lists the numbers for Scotland, Wales and Northern Ireland.
The short version
A range, not a number
The National Institute for Health and Care Excellence (NICE) calls a body mass index (BMI) of 18.5 to 24.9 a healthy weight, and the calculator turns that into kilos, or stones and pounds, for your height. NICE's overweight range starts lower, at 23, for people of South Asian, Chinese, other Asian, Middle Eastern, Black African or African-Caribbean background, so for them the range runs to a BMI of 22.9.
Devine's (1974) appeared in a paper on dosing the antibiotic gentamicin and still sets ventilators; Robinson's and Miller's (1983) were worked out for medicine doses from 1959 and 1983 US life-insurance tables; and Hamwi's (1964) was published by the American Diabetes Association in a text on diet therapy. They were made for clinical sums, not as weights to aim for.
The formulas give too little for short people and too much for tall people compared with a BMI range, and for a 6 ft 2 in man they differ by about 10 kg (our arithmetic). That's why doctors now use BMI ranges instead.
Its usual cut-offs miss about half of people with excess body fat, NICE advises caution with very muscular people and from 65, and a 2025 Lancet commission says BMI-based measures should be used "only as a surrogate measure of health risk at a population level".
The NHS says losing 5 to 10% of your weight can improve your health, and unfit people had about twice the mortality of fit people at any BMI. NICE asks for language that focuses on health rather than weight, so this page doesn't ask your weight.
Lowest = 18.5 × (height in m)²; highest = 24.9 × (height in m)², or 22.9 × (height in m)² on NICE's lower thresholds, where 22.9 is the top of the range below its overweight threshold of 23 (our reading). These are the same sums, with the same rounding, as our BMI calculator's "What the ranges mean for your height": kg to 0.1, whole pounds, or stones and whole pounds. NICE's bands are the same for women and men, so the range doesn't use your sex.
Inches over 5 ft = height in cm ÷ 2.54 - 60. Devine, Miller and Hamwi are as Peterson and colleagues reprint them in a 2016 analysis, Devine also as the Acute Respiratory Distress Syndrome (ARDS) Network's ventilator protocol prints it ("Males = 50 + 2.3 [height (inches) - 60]"); their original papers aren't online. Robinson is as his 1983 abstract publishes it. Peterson and most calculators print a rounded 52 + 1.9 and 49 + 1.7 kg, which gives 0.5 to 1.1 kg more from 5 ft 4 in to 6 ft 2 in (our arithmetic). Hamwi works in pounds, converted at 0.45359237 kg per pound.
Devine (1974): men 50 kg + 2.3 kg per inch over 5 ft; women 45.5 kg + 2.3 kg per inch
Robinson (1983): men 51.65 kg + 1.85 kg per inch over 5 ft; women 48.67 kg + 1.65 kg per inch
Miller (1983): men 56.2 kg + 1.41 kg per inch over 5 ft; women 53.1 kg + 1.36 kg per inch
Hamwi (1964): men 106 lb + 6 lb per inch over 5 ft; women 100 lb + 5 lb per inch
Each formula's weight in your units, the BMI it works out at for your height, what it was made for, and how far apart the four are. Choose "Prefer not to say" to see the versions for women and men side by side (our choice).
170 cm, the calculator's starting value: 53.5 to 72 kg (8 st 6 lb to 11 st 5 lb, or 118 to 159 lb), or to 66.2 kg on NICE's lower thresholds. For women, Devine gives 61.4 kg, Robinson 60.1, Miller 62.5 and Hamwi 61.1 (BMIs of 20.8 to 21.6); for men, 65.9, 64.5, 66 and 66.9 kg (22.3 to 23.2).
A woman of 5 ft 4 in (162.56 cm): 48.9 to 65.8 kg (7 st 10 lb to 10 st 5 lb, or 108 to 145 lb), or to 60.5 kg (9 st 7 lb) on the lower thresholds. Devine 54.7 kg, Robinson 55.3, Miller 58.5 and Hamwi 54.4 (120 lb): 4.1 kg apart.
A man of 5 ft 10 in (177.8 cm): 58.5 to 78.7 kg (9 st 3 lb to 12 st 6 lb). Devine 73 kg, Robinson 70.2, Miller 70.3 and Hamwi 75.3 (166 lb): 5.1 kg apart.
A man of 188 cm: 65.4 to 88 kg. Devine 82.2 kg, Robinson 77.6, Miller 76 and Hamwi 86.2: 10.3 kg apart, at BMIs from 21.5 to 24.4.
A woman of 155 cm: 44.4 to 59.8 kg, or 7 st 0 lb to 9 st 6 lb. Devine 47.9 kg (BMI 19.9), Robinson 50.4, Miller 54.5 and Hamwi 47.7 (BMI 19.8).
150 cm: 41.6 to 56 kg (6 st 8 lb to 8 st 12 lb). That's under 5 ft, so no formula figures.
NICE's healthy range and lower thresholdsStrong evidence
NICE: "healthy weight: BMI 18.5 kg/m2 to 24.9 kg/m2", with clinical judgement because someone in this range "may nevertheless have central adiposity". People of the listed backgrounds "are prone to central adiposity and their cardiometabolic risk occurs at lower BMI", so overweight starts at 23 and obesity at 27.5.
Insurance tables, then medicine dosesStrong evidence
Height-weight tables were built to compare groups, and their weights "were found to correlate with mortality", which is where "desirable" and "ideal" came from. Ideal weight was later used as a stand-in for lean body weight in drug dosing, and the formulas look alike because "the various height-weight tables from which they were derived" agree. Robinson's formulas were derived from the Metropolitan Life Insurance tables, so "formulas derived from actual height and weight data" could be used for drug doses.
The ARDS Network trial (861 patients) set breathing volumes per kg of "predicted body weight", worked out with Devine's formula: 6 ml per kg cut deaths to 31.0% from 39.8% at 12 ml per kg.
The formulas drift from a constant BMIStrong evidence
The BMIs the formulas fit best: Robinson 22.5 (men) and 21.0 (women), off by 0.4 and 0.7%; Devine 22.8 and 21.3; Hamwi 23.4 and 21.2; Miller 22.9 and 21.7, all off by 2.1% or more. For shorter heights the formulas sit closer to a BMI of 20 and for taller heights closer to 25, so "it might be more useful to use BMI ranges instead".
"'Ideal' or lowest-risk weights vary for different populations", over time and by cause of death, and "An ideal weight cannot be identified at a point in time for a person". Peterson: "IBW equations have largely been replaced by BMI ranges" (IBW is ideal body weight).
BMI misses about half of excess body fatStrong evidence
In 25 studies of 31,968 people, the usual BMI cut-offs picked out only half of the people with high body fat (a sensitivity of 0.50), though they correctly ruled out 90% of those without it. NICE advises caution with BMI in adults with high muscle mass and from 65, and the 2025 Lancet commission says BMI "can both underestimate and overestimate adiposity".
In never-smokers without disease, mortality was lowest at a BMI of 20 to 25 and higher on both sides. A meta-analysis using the standard categories instead found overweight linked with slightly lower mortality (a hazard ratio of 0.94), and in people over 65 overweight wasn't linked with higher mortality. Higher risk at the lowest weights and in the higher obesity classes is consistent.
In 32 studies of people aged 65 and over, mortality rose at the lower end of the healthy range and above a BMI of 33. Across ages, each 5 units above 25 carried less extra risk when BMI was measured at 70 to 89 than at 35 to 49. NICE asks clinicians to consider "the possible protective effect of having a slightly higher BMI when older".
In 10 studies, "unfit individuals had twice the risk of mortality regardless of BMI", and fit people with overweight or obesity had similar mortality to fit people of normal weight.
"Just losing a small amount of weight (5 to 10% of your body weight) can improve your health" (NHS), and NICE asks clinicians to "Encourage people to improve their dietary intake even if this does not result in them losing weight".
An international consensus says "weight stigma damages health, undermines human and social rights, and is unacceptable". NICE asks for "non-stigmatising language" and a focus on health and wellbeing, and reminds clinicians that people "can be affected by an eating disorder at any weight".
Published in a paper on gentamicin therapy, and "consistent with an old rule that was developed from height-weight tables". It mixes units, kilograms with inches, and is the ARDS Network's predicted body weight for setting ventilators.
"derived from the Metropolitan Life Insurance Company height and weight tables" by regressing median weight on height, for men and women "of all frame sizes"; Peterson dates the tables to 1959. Of the four, it lines up best with a single BMI.
Based on the 1983 Metropolitan Life tables and "motivated by applications to drug dosing". It was published as a letter with no abstract, so we use Peterson's reprint.
Published by the American Diabetes Association in a 1964 text on diet therapy, in pounds. Some calculators print a kilogram version for women, 45.5 kg + 2.2 kg per inch, which runs low as height rises because 5 lb is 2.27 kg: 0.3 kg low at 170 cm and 0.7 kg at 6 ft (our arithmetic). The calculator uses the pound version.
Some calculators add or take away about 10% for a small or large frame, or ask for your wrist size. We found no sound source for either, and Robinson worked his formulas out for all frame sizes together, so the calculator doesn't adjust (our choice).
The formulas give a single target weight, while most clinicians, and the data, support a range of target weights, Peterson writes. That's the range the calculator shows first.
If your GP has suggested losing weight, the NHS says losing 5 to 10% of your weight can improve your health: you don't need to reach a particular number. Eating better helps even if your weight doesn't change.
For adults with a BMI below 35, NICE suggests measuring your waist-to-height ratio as well as BMI, because it shows fat around the middle, which BMI can miss. Our waist-to-height ratio calculator works it out.
NICE suggests "non-stigmatising language (for example, 'living with overweight')" and talking about health rather than weight. So this page says "healthy weight range" and "your height", never "target weight" (our choice).
From 65, a weight at the bottom of the healthy range isn't a goal. European geriatric guidance says weight-loss diets for older people should only be considered for obesity with weight-related health problems, and combined with exercise. If you're losing weight without trying, see a GP.
The calculator stops: the adult range doesn't apply. For anyone aged 2 to 17, use the NHS BMI calculator for children and teenagers, which compares BMI with others of the same age and sex.
The calculator stops. "Weight gain in pregnancy varies greatly. Most pregnant women gain between 10kg and 12.5kg", and "pregnancy isn't the time to go on a diet". Your midwife can talk to you about your weight.
These numbers aren't the right tool, and NICE notes that eating disorders happen at any weight. The NHS adult BMI calculator isn't for anyone who has, or thinks they may have, an eating disorder. The calculator shows where to get help under every result, and the support section below has the numbers.
NICE advises caution with BMI from 65, and the lower end of the healthy range has been linked with higher mortality in older people, so the calculator adds a note.
If you need a weight for medicine doses or a ventilator
For drug dosing, ideal body weight is "used as a surrogate for lean body mass", and ventilators use predicted body weight. Your clinical team works these out; this page isn't for dosing.
The formulas were built from tables for men and women, but NICE's healthy range has no sex term and applies as it is. Choose "Prefer not to say" to see both formula columns (our choice).
"There's one ideal weight for your height"Strong evidence
The four formulas disagree by about 4 to 10 kg at common heights (our arithmetic), "An ideal weight cannot be identified at a point in time for a person", and NICE gives a range.
"A BMI of 18.5 to 24.9 is ideal for everyone"Strong evidence
NICE lowers the thresholds for some backgrounds, mortality in people over 65 was higher at a BMI of 20 to 21.9 than at 23 to 23.9, and BMI misses about half of people with excess body fat.
"Any weight above the healthy range shortens your life"Mixed evidence
Risk rose from a BMI of 25 in never-smokers, but another meta-analysis found overweight linked with slightly lower mortality, overweight wasn't linked with higher mortality after 65, and fit people with overweight or obesity did as well as fit people of normal weight.
"You have to reach your ideal weight to be healthier"Strong evidence
Losing 5 to 10% of your weight can improve your health, better eating helps even without weight loss, and unfit people had about twice the mortality at any BMI.
If you have, or think you might have, an eating disorder, these numbers aren't the right tool. See a GP as soon as you can, or talk in confidence to the eating disorder charity Beat: 0808 801 0677 (England), 0808 801 0432 (Scotland), 0808 801 0433 (Wales) or 0808 801 0434 (Northern Ireland). Beat's helplines are open 3pm to 8pm, Monday to Friday, and it also offers web chat and email. If you or someone else is in immediate danger, call 999 or Samaritans on 116 123; for medical advice, contact your GP or call 111.
The NHS lists signs such as spending a lot of time worrying about your weight and body shape, eating very little food, exercising too much, and having very strict habits or routines around food.
A GP can give you advice about your weight and refer you for support, including NHS weight management programmes, and you may be able to refer yourself without seeing a GP.
If numbers like these make you anxious, set goals for health and strength instead, such as walking further or lifting a little more (our suggestion, as in our exercise for weight loss guide).
Workouts to try
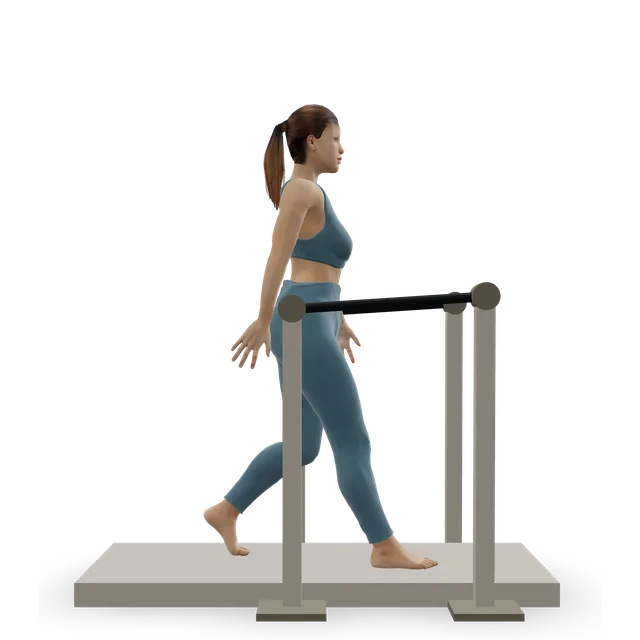
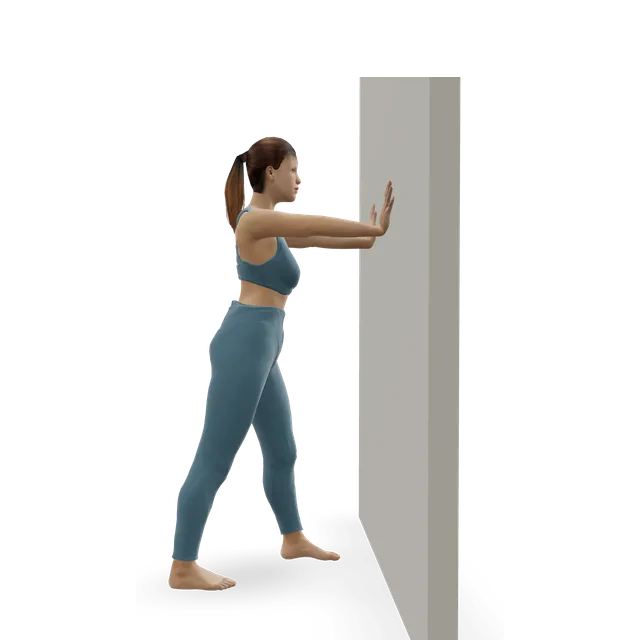
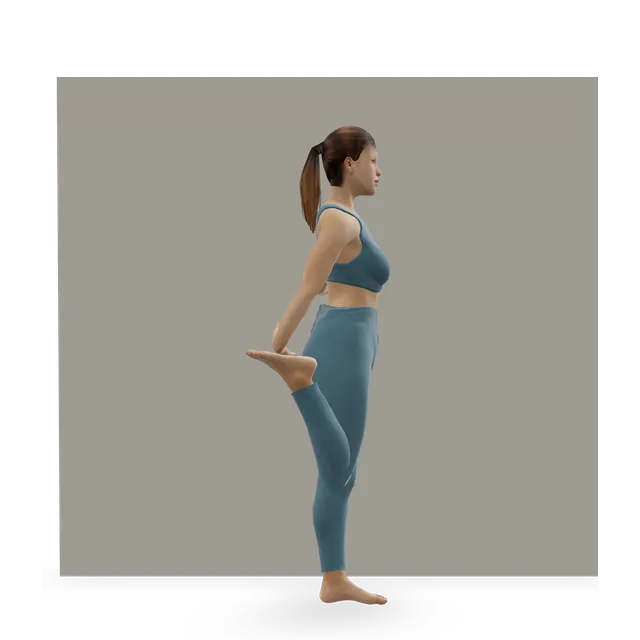
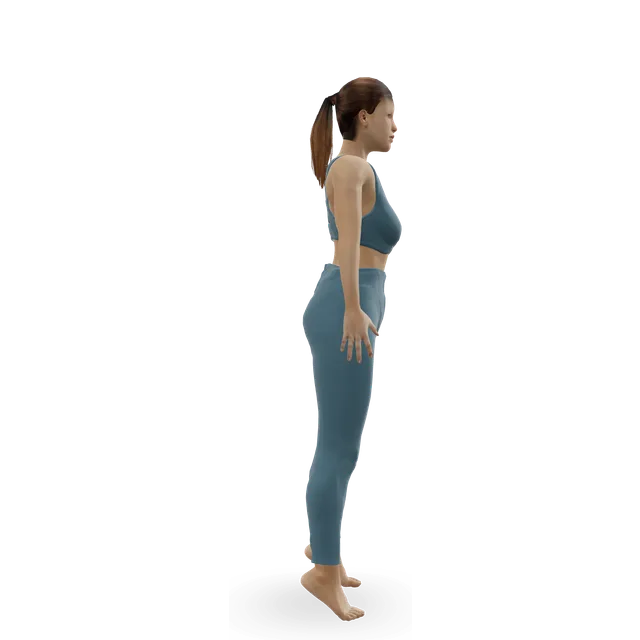
Fitness matters at any weight. These sessions build strength and stamina whatever the scales say, with strength and balance work for older adults.
There isn't a single one. A healthy weight for your height is a range: for a BMI of 18.5 to 24.9, about 58.5 to 78.7 kg (9 st 3 lb to 12 st 6 lb) at 5 ft 10 in, and 48.9 to 65.8 kg (7 st 10 lb to 10 st 5 lb) at 5 ft 4 in. NICE uses a lower top end, a BMI of 22.9, for some backgrounds.
What should I weigh for my height and age?
The adult healthy range doesn't change with age, but NICE advises caution with BMI from 65, and in older people the lower end of the range has been linked with higher mortality. If you're losing weight without trying, at any age, see a GP.
What is the Devine formula?
50 kg plus 2.3 kg for every inch over 5 ft for men, and 45.5 kg plus 2.3 kg per inch for women. It was published in 1974 in a paper on doses of the antibiotic gentamicin, and is still used to set ventilators as "predicted body weight". It wasn't designed as a weight to aim for.
Which ideal weight formula is most accurate?
None of them measures health. Robinson's lines up most closely with a single BMI, about 22.5 for men and 21 for women; the others drift, giving too little for short people and too much for tall people. That's why doctors now use BMI ranges instead.
Why do the formulas give different answers?
They come from different insurance tables and rules of thumb, made for different purposes, and each adds a fixed amount per inch, while a healthy weight range rises faster as height goes up. For a 6 ft 2 in man they differ by about 10 kg.
Is the healthy weight range different for women and men?
No: NICE's BMI ranges are the same for everyone. Only the four formulas have separate versions for women and men, so if you'd rather not choose, the calculator shows both.
Does body frame size change my ideal weight?
Some calculators add or take away about 10% for your frame or ask for your wrist size, but we couldn't find a sound source for that. Robinson worked his formulas out for all frame sizes together, and NICE suggests measuring your waist-to-height ratio alongside BMI.
What's a healthy weight for 5 ft 4 in?
For a BMI of 18.5 to 24.9, about 48.9 to 65.8 kg, or 7 st 10 lb to 10 st 5 lb (108 to 145 lb). On NICE's lower thresholds the top of the range is about 60.5 kg (9 st 7 lb).
Why doesn't this calculator ask my weight?
Because it isn't a weigh-in: it shows the range for your height and what the old formulas say. Our BMI calculator works out your BMI, and NICE suggests adults with a BMI under 35 also measure their waist-to-height ratio.
Is ideal body weight used for medicine doses?
Yes: that's what most of these formulas were made for, as a stand-in for lean body mass, and Devine's formula sets ventilator volumes. Your doctor, pharmacist or care team works out any dosing weight; this page isn't for that.
Estimates for healthy adults, not a personal prescription or a diagnosis, and clinical review of these pages is pending. Check with a GP before hard training or testing a maximum if you have a heart condition, high blood pressure, chest pain, dizziness or breathlessness when active, and stop for sharp or increasing pain. Health disclaimer.