Calculator

Lean body mass and FFMI calculator

Lean body mass is everything you weigh that isn't fat: mostly water, plus your organs, bones, skin and muscle. This calculator works it out from your body fat, which it can estimate with a tape measure as our body fat calculator does, or take from a scan, and then gives your fat-free mass index (FFMI), your lean mass for your height. It also shows what the four classic height-and-weight formulas predict, though they can't tell muscle from fat and can be 6 kg or more out for one person. No guideline sets a healthy range for either number.

Work out your lean body mass and FFMI

Enter your sex, age, height and weight in centimetres and kilograms, feet and stones, or feet and pounds. Then choose where your body fat figure comes from: your waist at the top of your hip bone (relative fat mass), the US Navy method's tape measurements, a figure you already have from a scan or scale, or height and weight only. Tick the box if you're pregnant.

Around your waist at the top of your hip bone, after breathing out.

Your lean body mass

60.4kg

From body fat of 24% (relative fat mass). Likely between 56.4 kg and 64.4 kg, because tape estimates of body fat are typically about 5 points out. Fat mass 19.6 kg.

Fat-free mass index (FFMI): 19.1 kg/m² (likely 17.8 to 20.3). Height-adjusted, as Kouri's 1995 study did it: 19.2 (17.9 to 20.5).

US men around age 40, measured by DXA scans (NHANES 1999 to 2004)
GroupMedian FFMIMiddle 90%
White20.016.5 to 25.2
Black20.616.5 to 26.5
Mexican American20.317.1 to 24.7

Medians from the published reference values (Kelly 2009); the middle 90%, the 5th to 95th percentiles, is our arithmetic from them. A scan and a tape measure don't give the same numbers, and there's no healthy FFMI range in any guideline.

Tape formulas tend to read high in lean people, so their lean mass reads low, and the Navy method reads low in people with more body fat, so theirs reads high. Body fat calculator

Lean body mass is everything that isn't fat: mostly water, plus organs, bone, skin and muscle. Only about half of it is muscle.

What height and weight alone predict
FormulaLean body mass
Janmahasatian (2005)Drug doses at any body size, from DXA scans of 373 adults61.1 kg76% of your weight
Boer (1984)Comparing blood and body fluid volumes between people60.9 kg76% of your weight
Hume (1966)Lean mass from body water, in 56 Glasgow hospital patients57.1 kg71% of your weight
James (1976)A UK report on obesity; later used to scale kidney function and drug doses62.1 kg78% of your weight

These formulas can't tell muscle from fat: very muscular people get too little, and the James formula breaks down at higher weights. Hume's are as published in 1966; Boer's, James's and Janmahasatian's are as later papers reprint them, because we couldn't open the originals.

If you check your body or your size a lot, or feel you're never big enough, that can be a sign of body dysmorphic disorder: see a GP, or refer yourself to NHS talking therapies. Anabolic steroids carry serious risks: the NHS on anabolic steroid misuse.

If you need a lean body weight for a medicine, a scan or an anaesthetic, your clinical team works it out; this page isn't for dosing.

If you have, or think you might have, an eating disorder, these numbers aren't the right tool. See a GP, or talk in confidence to Beat on 0808 801 0677 (England); Beat's helplines lists the numbers for Scotland, Wales and Northern Ireland.
The short version

Lean mass is mostly water, not muscle

About 73% of fat-free mass is water; the rest is protein and minerals in your muscles, organs, skin, blood and bones. Skeletal muscle is about 38% of body weight in men and 31% in women, roughly half of lean mass.

Sources 1, 2

Weight minus fat

Lean mass = weight × (1 - body fat % ÷ 100). The calculator estimates your body fat with the body fat calculator's own tape methods, relative fat mass or the US Navy method, or uses a figure from a scan. Tape estimates are typically about 5 points out, which is about 4 kg of lean mass either way at 80 kg.

Sources 3, 4

Height-and-weight formulas can't see muscle

Against dual-energy X-ray absorptiometry (DXA) scans in 1,558 UK adults, the four classic formulas read 1.1 to 4.1 kg higher on average, and for one person they could be about 6 to 8.5 kg out either way. For a muscular man they can be 13 to 20 kg too low (our arithmetic).

Source 5

FFMI is lean mass for your height

FFMI = lean mass (kg) ÷ height (m)². A 1995 study found drug-free men's height-adjusted values topped out at about 25, but later drug-tested athletes went above it, so 25 proves nothing about anyone.

Sources 6, 7

Reference values, not healthy ranges

US adults measured by DXA had median FFMIs of 18.4 to 20.6 (men) and 15.5 to 18.1 (women), depending on age and background, but the only FFMI cut-offs in any guideline are low ones for malnutrition: under 17 for men and 15 for women, alongside weight loss.

Sources 8, 9, 10

Muscle health is judged by strength

European sarcopenia guidance checks strength first, then measures the muscle in your arms and legs, because "strength is better than mass in predicting adverse outcomes".

Source 11

How the calculator works

The default: from your body fat

Lean mass = weight × (1 - body fat % ÷ 100), and fat mass is the rest. Body fat comes from the body fat calculator's methods, unchanged: relative fat mass, 64 - 20 × height ÷ waist, plus 12 for women, with the waist measured at the top of your hip bone (the default); or the US Navy method, from your neck and abdomen (men) or neck, waist and hips (women). Or you can type a figure you have from a scan or a body fat scale, from 2 to 60%. It's the same fat-free mass that the calorie calculator's lean mass equation uses.

Sources 3, 4

The range

Tape estimates get the body fat calculator's range, 5 points either way, so lean mass gets a range of 5% of your weight either way: 4 kg at 80 kg, about 3.3 kg at 65 kg. Relative fat mass read about 6.5 points high on average against a detailed laboratory reference (a five-compartment model), so its lean mass will often read low (our reading). A figure you type, from a scan or scale, is shown without a range.

Sources 3, 4, 12

FFMI and the height adjustment

FFMI = lean mass (kg) ÷ height (m)², shown to one decimal. The height-adjusted FFMI adds 6.3 × (1.80 - height in m), "a slight correction" that Kouri's 1995 abstract prints to compare everyone with a man of 1.8 m. Most calculators use 6.1, as a 2017 study of American football players did; the difference is at most 0.04 kg/m² between 1.6 and 2.0 m (our arithmetic). With a tape estimate, both get the same range as lean mass.

Sources 6, 7

Height and weight only

Without a body fat figure, the headline is Janmahasatian's 2005 formula. Against DXA in UK adults it agreed best in women, and the study's authors judged it, with one other equation, "optimal"; it was built on people of all sizes (a body mass index, BMI, of 17 to 70), and it levels off rather than falling at high BMI. Boer's, Hume's and James's formulas are shown below it. There's no FFMI on this route: from height and weight alone it would only restate your BMI.

Sources 5, 13

The four formulas

W is weight in kg, H is height in cm and BMI is W ÷ (H in m)². Hume's are as published in 1966. Boer's are as later papers reprint them, with height in cm; one reprint says metres, a misprint, because that would give a man of 1.75 m and 80 kg 13.8 kg of lean mass instead of 60.1 kg (our arithmetic). James's are as Hallynck 1981 reprints them, the earliest reprint we could open; one review also lists a different version with 120 for men. Janmahasatian's are as two later papers reprint them. We couldn't open Boer's, James's or Janmahasatian's original papers.

  • Janmahasatian (2005): men 9270 × W ÷ (6680 + 216 × BMI); women 9270 × W ÷ (8780 + 244 × BMI)
  • Boer (1984): men 0.407 × W + 0.267 × H - 19.2; women 0.252 × W + 0.473 × H - 48.3
  • Hume (1966): men 0.32810 × W + 0.33929 × H - 29.5336; women 0.29569 × W + 0.41813 × H - 43.2933
  • James (1976): men 1.10 × W - 128 × (W ÷ H)²; women 1.07 × W - 148 × (W ÷ H)²

Sources 5, 13, 14, 15, 16, 17, 18, 19

Why James's formula is hidden at a high BMI

James's formula takes away a term that grows with the square of your weight, so at a fixed height its estimate rises, peaks and then falls: the peak is at a BMI of 42.97 for men and 36.15 for women (our arithmetic; reprints say "about 37 and 43"). For a woman of 160 cm it gives 49.2 kg of lean mass at 100 kg but 45.2 kg at 120 kg. So the calculator doesn't show it from a BMI of 43.0 (men) or 36.1 (women).

Sources 17, 18

Rounding, checks and stops

Weights are shown as the BMI page shows them: kg to 0.1, whole pounds, or stones and whole pounds. Body fat is shown to a whole per cent, as on the body fat page, and lean mass is worked out from the unrounded figure. A tape estimate outside 2 to 60% body fat asks you to check your measurements. Under 18, or in pregnancy, the calculator stops: the formulas were built in adults.

Sources 13, 14

Worked examples (our arithmetic)

Rounded as the calculator rounds them.

  • A man of 40, 178 cm and 80 kg, with a waist of 90 cm at the top of his hip bone, the calculator's starting values: relative fat mass gives 24% body fat, so his lean mass is 60.4 kg (9 st 7 lb, or 133 lb), likely 56.4 to 64.4 kg, and his fat mass 19.6 kg. FFMI 19.1 (likely 17.8 to 20.3); height-adjusted, 19.2 (17.9 to 20.5).
  • The same man by the US Navy method, with a 38 cm neck and a 90 cm abdomen: 20% body fat, lean mass 63.8 kg, FFMI 20.1.
  • For comparison, the US survey's median FFMI for men around 40 was 20.0 (White), 20.6 (Black) and 20.3 (Mexican American).
  • A woman of 30, 165 cm and 65 kg, with a waist of 80 cm at the top of her hip bone: 35% body fat, lean mass 42.4 kg (6 st 10 lb), likely 39.2 to 45.7 kg; FFMI 15.6 (14.4 to 16.8), height-adjusted 16.5. The four formulas give 41.3 kg (Janmahasatian) to 46.6 kg (James).
  • A man of 28, 6 ft 0 in and 15 st 10 lb, with 15% body fat from a DXA scan: lean mass 84.8 kg (13 st 5 lb); FFMI 25.4, height-adjusted 25.2, so the note on the 25 limit shows. The formulas give 65.3 to 71.7 kg, 13 to 20 kg too little, because they can't see muscle.
  • A woman of 160 cm and 100 kg (BMI 39.1), height and weight only: Janmahasatian's formula gives 50.6 kg, Boer's 52.6 kg and Hume's 53.2 kg. James's isn't shown, because her BMI is past its peak.
  • The same woman at 120 kg (BMI 46.9): Janmahasatian 55 kg, Boer 57.6 kg, Hume 59.1 kg. James's would give 45.2 kg, less than at 100 kg.

Sources 3, 6, 8, 13

What the evidence says

What lean mass is made ofStrong evidence

The water content of fat-free mass "is stable at approximately 0.73". On whole-body magnetic resonance imaging (MRI) scans of 468 adults, skeletal muscle was 33.0 kg (38.4% of body weight) in men and 21.0 kg (30.6%) in women. Fat-free mass "is considered to closely approximate" lean body weight, and "there are no reference standards for LBW" (lean body weight).

Sources 1, 2, 13

The formulas against DXAEmerging evidence

In 1,558 UK adults aged 60 to 65, Hume's formula read 1.1 kg, Boer's 3.6 kg, James's 4.1 kg and Janmahasatian's 1.6 kg higher than DXA on average; in women, 3.8, 4.5, 4.9 and 0.9 kg. For one person, the 95% limits of agreement were about 6 to 8.5 kg either way. The authors judged Janmahasatian's and one other equation "optimal and almost indistinguishable", and noted that most equations were developed in white populations.

Source 5

Further out in some groupsEmerging evidence

In 1,655 Australian men aged 70 and over, Janmahasatian's formula read 5.5 kg higher than DXA on average. In 70 women with an average BMI of about 48, "most previously reported estimating equations for LBW predicted FFW poorly" (FFW is fat-free weight). In people with severe obesity before and after weight-loss surgery, prediction equations agreed with DXA for groups but "their individual-level performance was inconsistent".

Sources 20, 21, 22

Built for drug doses, not fitnessStrong evidence

Boer's formula was published to compare body fluid volumes between people of different sizes, James's was used to scale kidney function and drug doses, and Janmahasatian's was built for drug doses because "the current methods for predicting LBW are inconsistent at extremes of size". They're still used to set doses of the contrast dye for computed tomography (CT) scans.

Sources 13, 15, 16, 17, 18

Tape estimates of body fatEmerging evidence

In relative fat mass's own validation, the middle half of its errors spanned 4.9 points in women and 4.2 in men. Against a five-compartment model it read 6.5 points high on average. A tape method like the US Navy's read 2.5 to 2.6 points low in male US Marines and 1.3 to 2.3 points high in female Marines, overestimating lean people and underestimating people with more fat.

Sources 3, 4, 12

Kouri's FFMI of 25Emerging evidence

Kouri's 1995 study of 157 male athletes, 83 who used anabolic steroids and 74 who didn't, found the non-users' height-adjusted FFMIs "extended up to a well-defined limit of 25.0", while some users went above 30; the authors called the findings "preliminary". Of 235 college American football players scanned by DXA, 23% were above 25 by Kouri's formula, up to 31.7. They faced random drug testing, though the study didn't test them, and the authors thought steroids an unlikely explanation.

Sources 6, 7

Reference valuesStrong evidence

In US adults measured by DXA in the National Health and Nutrition Examination Survey (NHANES), median FFMIs were 18.4 to 20.6 in men and 15.5 to 18.1 in women across ages 20 to 80 and three groups. Swiss adults aged 18 to 34 had medians of 18.9 (men) and 15.4 (women) by bioimpedance, and UK Biobank adults aged 45 to 69 averaged 18.3, men and women together. These describe populations; they aren't healthy ranges.

Sources 8, 23, 24

Low FFMI and malnutritionStrong evidence

The European Society for Clinical Nutrition and Metabolism (ESPEN) counts "unintentional weight loss (mandatory)" plus a low BMI or a low FFMI as malnutrition: "Low FFMI is <15 and <17 kg/m2 in females and males, respectively". The Global Leadership Initiative on Malnutrition (GLIM) lists the same values as examples of reduced muscle mass.

Sources 9, 10

Strength first for muscle lossStrong evidence

The European Working Group on Sarcopenia in Older People (EWGSOP2) puts low strength first: "strength is better than mass in predicting adverse outcomes". Low muscle quantity, measured by DXA or bioimpedance, then confirms it: muscle in the arms and legs (appendicular muscle) under 20 kg in men or 15 kg in women, or under 7.0 and 5.5 kg/m² for height. Bioimpedance "does not measure muscle mass directly", and different makes of DXA scanner don't give the same results.

Source 11

FFMI and the "natural limit"

What FFMI is

Your lean mass for your height, like BMI without the fat: FFMI = lean mass (kg) ÷ height (m)². The height-adjusted version compares you with a man of 1.8 m: it adds a little if you're shorter and takes a little off if you're taller.

Source 6

What 25 does and doesn't mean

An FFMI above 25 is uncommon in lean men, and Kouri suggested it as a way to screen for possible steroid use. But some drug-tested athletes are above it, and so are about 1 in 20 White US men aged 30 to 50, and more Black men, in a national survey of people of all builds (our arithmetic from the published reference values, which aren't adjusted for height). On its own it shows nothing about anyone.

Sources 6, 7, 8

No limit for women

Kouri studied men only. The "steroid" bands for women on some calculator sites have no published source, so this calculator shows none.

Source 6

From a formula, FFMI is BMI in disguise

Janmahasatian's lean mass ÷ height² depends only on BMI: for men, 16.9 at a BMI of 20, 19.2 at 25, 21.1 at 30 and 22.8 at 35 (our algebra). That's why the calculator gives FFMI only with a body fat figure.

Source 13

The reference table

The calculator compares your FFMI with US adults of your sex and nearest age (in steps of 5 years, from 20 to 85) measured by DXA in NHANES: the medians from the published values, and the 5th to 95th percentiles worked out from them (our arithmetic from the published reference values). The survey left out people over 136 kg or 196 cm, a scan and a tape measure don't give the same numbers, and these are US groups as the survey defined them.

Source 8

Lean mass and muscle loss with age

Strength comes first

Guidance on sarcopenia, the loss of muscle strength and size with age, checks your grip or how fast you can stand up from a chair before measuring muscle. Our sarcopenia guide and grip strength test explain how.

Source 11

A formula can't see muscle loss

Total lean mass from a formula can't detect low muscle in your arms and legs, and it moves only when your weight moves. If you're worried about losing muscle, see a GP.

Sources 5, 11

Lean mass moves with water

Lean mass is about 73% water, and DXA readings change with how hydrated you are, so a change of a kilo or two from one day to the next is more likely to be water than muscle (our reading).

Sources 1, 11

Changes with age

Muscle as a share of body weight starts to fall in early adult life, and the amount of muscle from about 50, mostly in the legs. In the US survey, lean mass for height peaked between 40 and 50.

Sources 2, 8

Who it isn't for

Under 18

The calculator stops. The formulas were built in adults: Janmahasatian's in people aged 18 to 82, and Hume judged his women's formula "probably only applicable to those over the age of 30". The body fat formulas are for adults too.

Sources 13, 14

During pregnancy

The calculator stops: your weight includes your pregnancy, and neither the formulas nor relative fat mass apply.

Eating disorders, body worries or steroids

These numbers aren't the right tool. The calculator shows where to get help under every result, and the support section below has the numbers.

Sources 25, 26, 27, 28

Very muscular

Height-and-weight formulas assume an average build, so they give too little lean mass. Use a tape method or a figure from a scan.

Source 5

A high BMI

James's formula breaks down above a BMI of about 36 (women) or 43 (men), and most formulas did poorly at a BMI around 48. The calculator hides James's at those BMIs; Janmahasatian's formula or a body fat figure is a better guide.

Sources 17, 18, 21

Worried about muscle loss

Sarcopenia is diagnosed by strength first, then by measuring the muscle in your arms and legs on a scan. See our sarcopenia guide and a GP.

Source 11

Fluid build-up or dialysis

Fluid counts as lean mass, and DXA readings change with hydration. If you have swelling from heart, kidney or liver disease, or you're on dialysis, your care team can measure this properly.

Sources 1, 11

After an amputation

The formulas assume a whole body, so they don't fit. Your care team can adjust for it.

Taking gender-affirming hormones

Hormone treatment changes body fat and lean mass, and every formula is for women or men. None was built for this; your clinic can advise.

Source 29

If you need a dosing weight

If you need a lean body weight for a medicine, a scan or an anaesthetic, your clinical team works it out; this page isn't for dosing.

Sources 13, 18

Common myths

"Lean body mass is your muscle"Strong evidence

It's mostly water, about 73% of fat-free mass, with organs, bone, skin and blood. Skeletal muscle is roughly half of it.

Sources 1, 2

"The Boer formula is the most accurate"Emerging evidence

In 1,558 UK adults, Boer's read 3.6 kg higher than DXA on average, and 4.5 kg in women, while Janmahasatian's was among the closest.

Source 5

"An FFMI over 25 means steroids"Emerging evidence

The 25 came from 74 lean, drug-free men in a study its authors called preliminary. Of 235 college football players who face drug testing, 23% were above it, and so are about 1 in 20 White US men aged 30 to 50 (our arithmetic, from values not adjusted for height).

Sources 6, 7, 8

"Women's natural FFMI limit is 21.5"Mixed evidence

Kouri studied men only, and the women's bands on calculator sites have no published source.

Source 6

"A healthy lean body mass is 68 to 90% of your weight"Mixed evidence

That's a body fat range in disguise, 10 to 32% fat, with no published source. The only cut-offs in any guideline are low FFMIs used to diagnose malnutrition.

Sources 9, 10

"A lean body mass formula will show my muscle gains"Strong evidence

Hume's and Boer's formulas count a fixed 25 to 41% of every kilo as lean, whatever it is (our algebra), and no height-and-weight formula can tell muscle from fat.

Sources 5, 14

"More lean mass means healthier muscles"Strong evidence

Guidelines judge muscle by strength first: "strength is better than mass in predicting adverse outcomes".

Source 11

If you're worried about your body or eating

Eating disorders

If you have, or think you might have, an eating disorder, these numbers aren't the right tool. See a GP as soon as you can, or talk in confidence to the eating disorder charity Beat: 0808 801 0677 (England), 0808 801 0432 (Scotland), 0808 801 0433 (Wales) or 0808 801 0434 (Northern Ireland). Beat's helplines are open 3pm to 8pm, Monday to Friday, and it also offers web chat and email. If you or someone else is in immediate danger, call 999 or Samaritans on 116 123; for medical advice, contact your GP or call 111.

Sources 25, 26

Body image and muscle size

If you check your body or your size a lot, compare your looks with other people's, or feel you're never big enough, that can be a sign of body dysmorphic disorder (BDD). The NHS says to see a GP if you think you might have BDD, and you can also refer yourself to NHS talking therapies.

Source 27

Anabolic steroids

The NHS says people with BDD may take anabolic steroids because they "do not see themselves as being physically big enough or strong enough". It lists harms including infertility, shrunken testicles and breast development in men, extra facial and body hair and a deeper voice in women, and aggression, mood swings and paranoia. See a GP if you think you're addicted; the FRANK drugs advice service can help too.

Source 28

Losing weight without trying

Weight loss you didn't intend is the first thing clinicians look for in malnutrition. If you've lost weight without trying, see a GP.

Sources 9, 10

Goals that aren't numbers

If numbers like these make you anxious, set goals for health and strength instead, such as walking further or lifting a little more (our suggestion, as in our exercise for weight loss guide).

Workouts to try

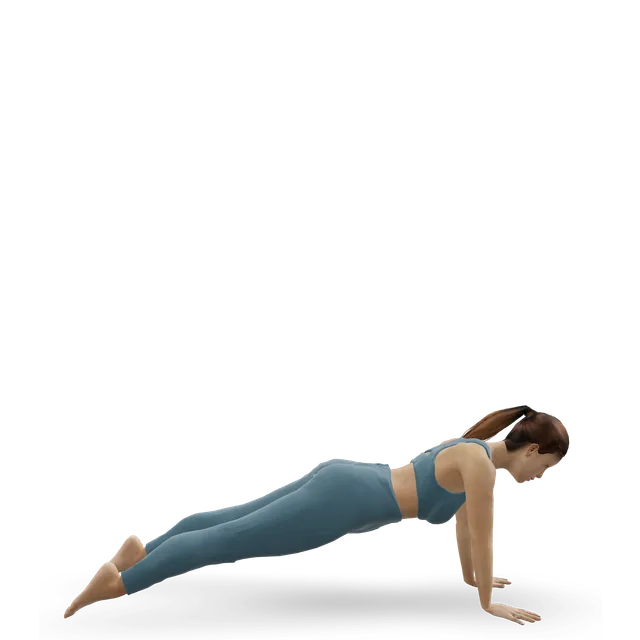
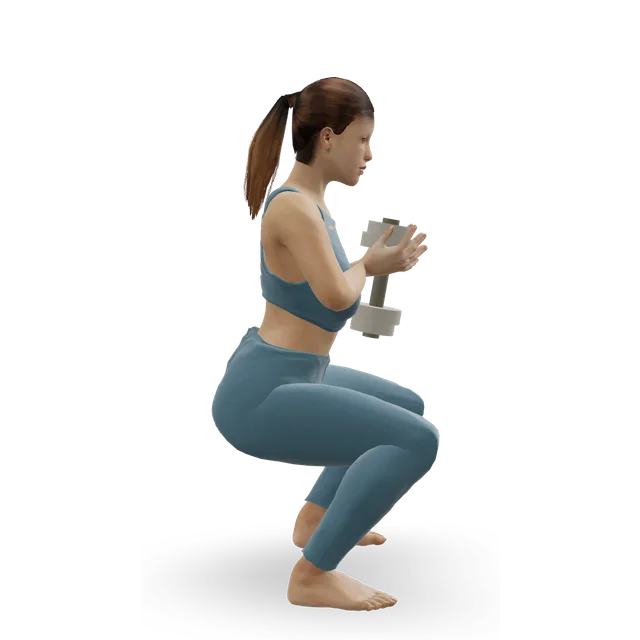
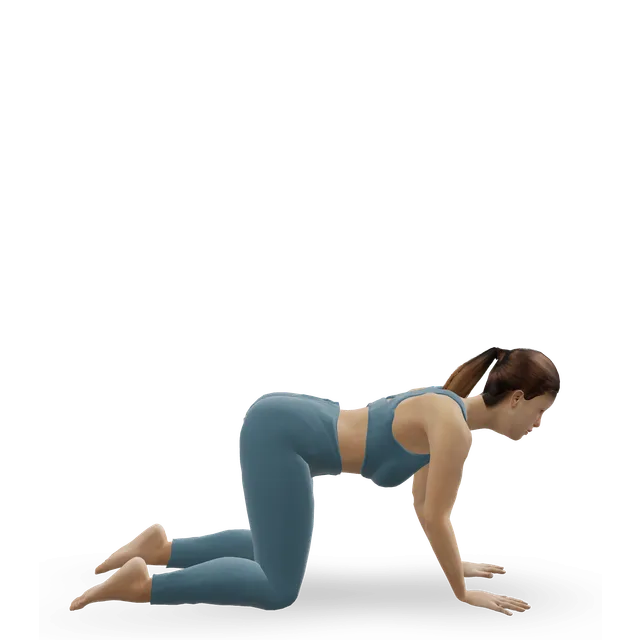
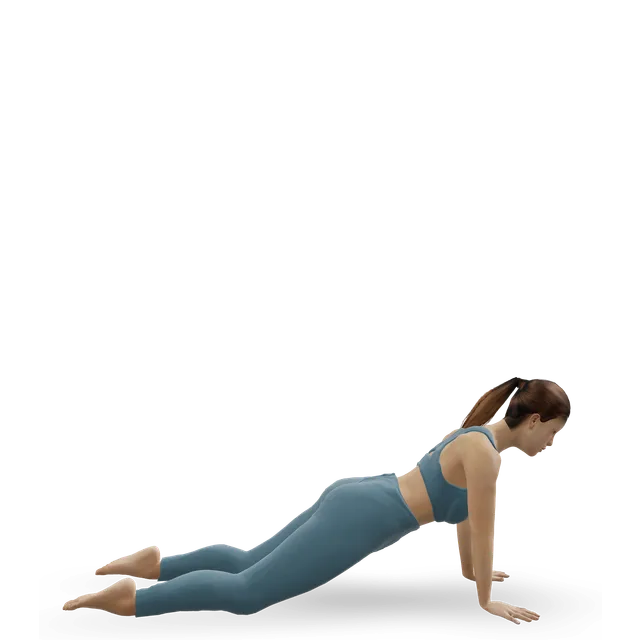
Strength training builds and keeps muscle at any age. Start with the 20-minute or bodyweight sessions, then move to the dumbbell or gym workouts; the strength and balance session suits older adults.

Questions people ask

What is lean body mass?

Everything you weigh that isn't fat. About three-quarters of it is water, and the rest is protein and minerals in your muscles, organs, skin, blood and bones; skeletal muscle makes up roughly half of it.

How do I calculate my lean body mass?

Take away your fat: lean mass = weight × (1 - body fat % ÷ 100). The calculator can estimate your body fat with a tape measure, the same way our body fat calculator does, or use a figure from a scan. Without a body fat figure, it uses formulas based on your height and weight.

Which lean body mass formula is most accurate?

In 1,558 UK adults aged 60 to 65 checked against DXA scans, Janmahasatian's formula came closest overall, especially in women, while Boer's and James's read 3.6 and 4.1 kg high on average. All of them can be 6 kg or more out for one person, and none can tell muscle from fat.

What is FFMI and how is it calculated?

Fat-free mass index is your lean (fat-free) mass in kilograms divided by your height in metres squared, like BMI without the fat. The height-adjusted version adds 6.3 × (1.8 - your height in metres), as Kouri's 1995 study printed it; most calculators use 6.1, which makes almost no difference.

What is a good FFMI?

No guideline sets a healthy range. In a US survey measured by DXA, median values were 18.4 to 20.6 for men and 15.5 to 18.1 for women, depending on age and background. Clinicians use under 17 (men) or 15 (women), with weight loss you didn't intend, as one sign of malnutrition.

Is an FFMI of 25 the natural limit?

It came from one 1995 study of 74 drug-free men who trained with weights, whose height-adjusted values topped out at about 25. Later, nearly a quarter of college American football players, who face random drug testing, were above it, and so are about 1 in 20 White US men aged 30 to 50 in a national survey, before adjusting for height. It isn't proof of steroid use, and no limit has been studied in women.

Is lean body mass the same as muscle mass?

No: muscle is only about half of it, and the rest is water, organs, bone and skin. Doctors check for muscle loss with strength tests first, then by measuring the muscle in your arms and legs on a scan, not by total lean mass.

Why do the formulas give me different answers?

They were built in different groups for different jobs: Hume's from 56 Glasgow hospital patients, Boer's to compare body fluid volumes, James's for a UK report on obesity, and Janmahasatian's from DXA scans of 373 people of all sizes. For a woman of 165 cm and 65 kg, they range from 41.3 to 46.6 kg.

Can I use this to track muscle gain?

Not with the height-and-weight formulas: they change only when your weight changes, and typical gains of 1 to 1.5 kg of muscle are smaller than their error. Repeat the same tape method or scan in the same conditions, and watch your strength.

Should I set my protein by lean body mass?

Our protein calculator uses your body weight, as UK, European and US guidelines do, and the weight for a BMI of 25 at your height if your BMI is 30 or more. It explains the options.

Sources

  1. Wang 1999 · Hydration of fat-free body mass: a classic body composition constant (review, Am J Clin Nutr)
  2. Janssen 2000 · Skeletal muscle mass and distribution in 468 adults aged 18 to 88, by MRI (study, J Appl Physiol)
  3. Woolcott and Bergman 2018 · Relative fat mass as an estimator of body fat, from DXA in US adults (study, Sci Rep)
  4. Potter 2022 · Tape-measure body fat predictions against DXA in US Marines (study, Front Physiol)
  5. Puri and Blake 2022 · Ten lean body mass equations against DXA in 1,558 UK adults aged 60 to 65 (study, Br J Radiol)
  6. Kouri 1995 · Fat-free mass index in 157 male athletes who did and didn't use anabolic steroids (study, Clin J Sport Med)
  7. Trexler 2017 · Fat-free mass index in 235 college American football players (study, J Strength Cond Res)
  8. Kelly 2009 · DXA body composition reference values from NHANES, including lean mass for height by age, sex and group (reference study, PLoS One)
  9. Cederholm 2015 · Diagnostic criteria for malnutrition (ESPEN consensus statement, Clin Nutr)
  10. Cederholm 2019 · GLIM criteria for the diagnosis of malnutrition (consensus report, J Cachexia Sarcopenia Muscle)
  11. Cruz-Jentoft 2019 · Sarcopenia: revised European consensus on definition and diagnosis (EWGSOP2, Age Ageing)
  12. Cicone 2021 · Body fat equations from body measurements against a five-compartment model (study, Med Sci Sports Exerc)
  13. Janmahasatian 2005 · Quantification of lean bodyweight, from DXA scans of 373 adults (study, Clin Pharmacokinet)
  14. Hume 1966 · Prediction of lean body mass from height and weight, in 56 hospital patients (study, J Clin Pathol)
  15. Boer 1984 · Estimated lean body mass as an index for normalising body fluid volumes (study, Am J Physiol)
  16. Hallynck 1981 · Should clearance be normalised to body surface or to lean body mass? Reprinting the James formula (study, Br J Clin Pharmacol)
  17. Henning 2023 · Strategies for calculating contrast doses for chest CT, reprinting the lean body weight formulas (review, Eur Radiol Exp)
  18. Caruso 2018 · Lean body weight for contrast doses in patients with obesity: the Boer against the James formula (study, Biomed Res Int)
  19. Yu 2013 · Lean body mass prediction equations in healthy adults, reprinting Janmahasatian's (study, BMC Pharmacol Toxicol)
  20. Mitchell 2010 · Lean body weight equations against DXA in 1,655 men aged 70 and over (study, Br J Clin Pharmacol)
  21. Bucaloiu 2011 · Fat-free weight prediction in 70 women with severe obesity (study, Int J Nephrol Renovasc Dis)
  22. Gómez-Bruton 2026 · Prediction equations for lean tissue and fat-free mass in class II to V obesity, before and after weight-loss surgery (multicentre study, J Obes Metab Syndr)
  23. Schutz 2002 · Fat-free mass index and fat mass index percentiles in 5,635 Swiss adults (study, Int J Obes)
  24. Franssen 2014 · Body composition reference values by bioimpedance in 186,975 adults aged 45 to 69: UK Biobank (study, J Am Med Dir Assoc)
  25. NHS · Eating disorders: overview
  26. Beat · Helplines and support
  27. NHS · Body dysmorphic disorder (BDD)
  28. NHS · Anabolic steroid misuse
  29. Klaver 2018 · Body fat, lean mass and body shape in trans people in their first year of hormone treatment (cohort study, Eur J Endocrinol)

Estimates for healthy adults, not a personal prescription or a diagnosis, and clinical review of these pages is pending. Check with a GP before hard training or testing a maximum if you have a heart condition, high blood pressure, chest pain, dizziness or breathlessness when active, and stop for sharp or increasing pain. Health disclaimer.