Calculator

Waist-to-hip ratio calculator: WHO cut-offs and how to measure

Your waist-to-hip ratio is your waist measurement divided by your hip measurement. It shows where you carry fat rather than how much: in large studies, a higher ratio went with more heart attacks and type 2 diabetes. The World Health Organization (WHO) counts 0.90 or more for men, and 0.85 or more for women, as a substantially increased risk. Measure your waist halfway between your lowest rib and the top of your hip bone, and your hips around the widest part of your bottom, then enter both. Add your height and the calculator also shows your waist-to-height ratio from the same tape measurement, the measure the National Institute for Health and Care Excellence (NICE) uses.

Work out your waist-to-hip ratio

Enter your waist and hips in centimetres or inches, and choose female or male, or show both of WHO's cut-offs. Add your height for your waist-to-height ratio from the same waist, and your age if you like. Tick a box if you're pregnant or your body mass index (BMI) is 35 or more.

WHO's cut-offs differ for women and men. "Show both" gives both.

Halfway between your lowest rib and the top of your hip bone, just above the belly button, after breathing out normally.

Around the widest part of your bottom, with the tape level.

Height is optional: it gives your waist-to-height ratio from the same waist.

Your waist-to-hip ratio

0.80

Below WHO's cut-off for women (0.85). WHO gives no lower, healthy band.

Waist ÷ hips: 80 ÷ 100 = 0.80

From the same waist, your waist-to-height ratio is 0.48. NICE's band: healthy central adiposity: waist-to-height ratio 0.4 to 0.49, indicating no increased health risks. Waist-to-height ratio calculator

Risk rises steadily with the ratio rather than jumping at the cut-off, so being just under it isn't an all-clear.

This ratio shows where you carry fat, not how much. In big studies a higher ratio went with more heart attacks and type 2 diabetes, but on its own it doesn't diagnose anything or tell you your own risk.

A centimetre or two either way can move your ratio by about 0.02, and people measuring themselves tend to read their waist a little small. Measure twice and use the average.

WHO's cut-offs
A substantially increased risk of metabolic complications
SourceWomenMen
WHO, 1999Its working definition of the metabolic syndromeabove 0.85above 0.90
WHO, 2008 consultationReprinted among "the recommendations often attributed to WHO"0.85 or more0.90 or more

The calculator counts a ratio of exactly 0.85 or 0.90 as at the cut-off, as the 2008 table does. WHO gives no lower band, and its 2008 consultation set no cut-offs of its own.

If you have, or think you might have, an eating disorder, these numbers aren't the right tool. See a GP, or talk in confidence to Beat on 0808 801 0677 (England); Beat's helplines lists the numbers for Scotland, Wales and Northern Ireland.

The short version

Waist divided by hips

Measure your waist halfway between your lowest rib and the top of your hip bone, the site WHO and NICE both use, and your hips around the widest part of your bottom, in the same units. Then divide: a waist of 80 cm and hips of 100 cm give 0.80. The ratio has no units, so inches give the same answer.

Sources 1, 2

WHO's cut-offs: 0.90 and 0.85

WHO's 1999 report on diabetes counted a ratio above 0.90 in men, or above 0.85 in women, as central obesity, and WHO's 2008 expert consultation listed 0.90 or more and 0.85 or more as a "substantially increased" risk of metabolic complications. WHO sets no lower, healthy band.

Sources 1, 3

It tracks heart risk in big studies

In 27,098 people in 52 countries, heart attack risk rose with every fifth of the ratio, and in 479,610 UK adults the ratio was more closely linked with heart attacks than BMI, especially in women. Across 31 cohort studies, each 0.1 higher went with 20% higher mortality.

Sources 4, 5, 6

But it doesn't beat the waist-to-height ratio

For future type 2 diabetes the waist-to-height ratio was the stronger marker, NICE found the measures similarly accurate overall, and in 58 studies none of BMI, waist or waist-to-hip ratio improved heart risk prediction once blood pressure, diabetes and cholesterol were known.

Sources 7, 8, 9

It's hard to measure well

People's own measurements of their ratio matched a trained measurer's poorly, and repeat measurements of the ratio agreed less well than repeat waist or BMI measurements. A centimetre or two either way can move it by about 0.02, enough to cross a cut-off.

Sources 9, 10, 11

A marker, not a target

Risk rises steadily with the ratio rather than stepping up at the cut-off, so being just under it isn't an all-clear. The "ideal" 0.7 you may see comes from studies of attractiveness, not health.

Sources 6, 12

How the calculator works

The sum

Waist-to-hip ratio = waist ÷ hips, in the same units: WHO describes it as "the waist circumference divided by the hip circumference". The calculator shows it to two decimal places and classes the ratio it shows, as our waist-to-height ratio calculator does, so 0.896 shows as 0.90 and counts as at the men's cut-off. Switching between centimetres and inches converts your measurements to the nearest half.

Source 1

Measuring, as WHO describes it

WHO's 2008 consultation measures the waist "at the midpoint between the lower margin of the least palpable rib and the top of the iliac crest" (the top of the hip bone), and the hips "around the widest portion of the buttocks, with the tape parallel to the floor", standing with feet close together and arms at the side, "at the end of a normal expiration". Each is measured twice and averaged if the two are within 1 cm. NICE's waist is the same, "midway between these points (this will be just above the belly button)", and the NHS adds: "Breathe out naturally, do not hold your tummy in".

Sources 1, 2, 13

Where the cut-offs come from

WHO's 1999 report on diagnosing diabetes suggested a "working definition" of the metabolic syndrome, to be improved on later, that counted "Central obesity (males: waist to hip ratio > 0.90; females: waist to hip ratio > 0.85) and/or BMI > 30". WHO's 2008 consultation reprinted these cut-offs, in a table of "the recommendations often attributed to WHO", as 0.90 or more (men) and 0.85 or more (women) for a "substantially increased" risk of metabolic complications. The same annex warns that the waist sizes credited to WHO "were an example only": that warning is about waist sizes, not these ratios, which are in WHO's own 1999 report. The consultation set no cut-offs of its own: "Making definitive decisions on actual cut-off points was outside the scope of the consultation".

Sources 1, 3

At the cut-off, and below it

The calculator counts a ratio at or above the cut-off, as the 2008 table prints it. The 1999 wording says "above", so a ratio of exactly 0.90 (men) or 0.85 (women) counts under the 2008 table but not the 1999 definition (our reading). Below the cut-off, the result says only that: WHO gives no lower band, and risk rises steadily with the ratio, so the calculator never calls a ratio healthy or low risk.

Sources 1, 3, 6

Your waist-to-height ratio from the same waist

Add your height and the calculator divides the same waist by it and gives NICE's band, as our waist-to-height ratio calculator does: 0.4 to 0.49 is "healthy central adiposity", 0.5 to 0.59 "increased" and 0.6 or more "high". NICE uses that ratio only for adults with a BMI under 35, so if you tick that box, the calculator leaves it out.

Source 2

Checks and stops

Under 18, or in pregnancy, the calculator stops. A ratio below 0.5 or above 1.5 is so unusual that it asks you to check your measurements instead of giving a cut-off (our choice; the average in UK Biobank was 0.875). With "Show both", the result gives WHO's cut-off for women and for men. If you give an age of 65 or more, it notes that the ratio predicts less well in older people.

Sources 1, 14

Worked examples (our arithmetic)

Rounded as the calculator rounds them.

  • A woman with a waist of 80 cm, hips of 100 cm and a height of 165 cm, the calculator's starting values: 80 ÷ 100 = 0.80, below WHO's 0.85 for women. From the same waist, her waist-to-height ratio is 0.48, healthy central adiposity on NICE's bands.
  • A man with a waist of 96 cm, hips of 102 cm and a height of 178 cm: 0.9412, shown as 0.94, at or above WHO's 0.90 for men. His waist-to-height ratio is 0.54, increased.
  • A woman with a 34 in waist, 40 in hips and a height of 5 ft 5 in: exactly 0.85, at WHO's cut-off. The 2008 table counts it; the 1999 wording, "above 0.85", wouldn't. Her waist-to-height ratio is 0.52, increased.
  • A man with a 36 in waist, 39 in hips and a height of 5 ft 10 in: 0.9231, shown as 0.92, at or above 0.90. His waist-to-height ratio is 0.51, increased.
  • A man with a waist of 89.6 cm and hips of 100 cm: 0.896, shown as 0.90, so at the cut-off, because the calculator classes the ratio it shows.
  • A woman with hips of 100 cm: a waist of 84.4 cm gives 0.84, below 0.85, and 84.6 cm gives 0.85, at the cut-off. That's 2 mm of tape.
  • A man with a waist of 104 cm, hips of 98 cm and a height of 175 cm: 1.0612, shown as 1.06, at or above 0.90. His waist-to-height ratio is 0.59, increased.
  • A waist of 50 cm and hips of 125 cm: 0.40, below 0.5, so the calculator asks you to check your measurements.

Sources 1, 2

What the evidence says

Heart attacks: more closely linked than BMIStrong evidence

INTERHEART compared 12,461 people who'd had a heart attack with 14,637 who hadn't, in 52 countries. Each fifth of the ratio carried more risk than the one below it, up to an odds ratio of 2.52 for the top fifth against the bottom (1.75 after other risk factors), and the top two fifths of the ratio accounted for 24.3% of heart attacks, against 7.7% for the top two fifths of BMI. In UK Biobank, each standard deviation of the ratio went with a 49% higher risk of heart attack in women and 36% in men, against 22% and 28% for BMI.

Sources 4, 5

Heart disease and deathStrong evidence

Across 15 studies of 258,114 people, each 0.01 rise in the ratio went with 5% more cardiovascular events. In nine British cohorts (82,864 people), the ratio and waist were each linked with deaths from cardiovascular disease, 15% more per standard deviation, and no measure picked out risk better than the others. In 359,387 Europeans, the top fifth of the ratio carried a 68% (men) and 51% (women) higher risk of death after allowing for BMI. Across 31 cohort studies, each 0.1 higher went with 20% higher mortality, and across 9, each 10 cm more hip went with 10% lower.

Sources 6, 15, 16, 17

Probably a cause, not only a markerEmerging evidence

People with genes for a higher ratio, whatever their BMI, had more type 2 diabetes (an odds ratio of 1.77 per standard deviation) and coronary heart disease (1.46), which the authors called "supportive of a causal association between abdominal adiposity and these outcomes".

Source 14

Against the waist-to-height ratioMixed evidence

For future type 2 diabetes (15 studies), the relative risk per standard deviation was 1.62 for the waist-to-height ratio, 1.63 for waist, 1.55 for BMI and 1.52 for the waist-to-hip ratio. Across 10 studies the waist-to-height ratio was the best at picking out high blood pressure, diabetes and abnormal blood fats. For heart attacks in UK Biobank, the waist-to-hip ratio was a little stronger in women (1.49 against 1.34 per standard deviation) and similar in men (1.36 against 1.33).

Sources 5, 7, 18

It adds little to a health checkStrong evidence

In 58 studies of 221,934 people, BMI, waist and waist-to-hip ratio, alone or together, "do not importantly improve cardiovascular disease risk prediction" once blood pressure, diabetes and cholesterol are known. The ratio was also the least repeatable of the three: measured again, it agreed less well than waist or BMI.

Source 9

Why NICE chose the waist-to-height ratioStrong evidence

NICE's 2022 evidence review found BMI, waist, waist-to-hip and waist-to-height ratios "overall were similar in their accuracy". NICE chose the waist-to-height ratio because it "only requires one additional measurement", its classification "is the same for all ethnicities and sexes", and it conveys the message that "your waist should be half your height". WHO, too, favours waist size "due to the relative ease of obtaining" it: "Measuring hip circumference may be more difficult than measuring waist circumference alone".

Sources 1, 8, 19

Measuring is the weak pointStrong evidence

In 4,492 British adults, people measured their own waist 3.1 cm (men) and 1.9 cm (women) smaller than a technician did, and their ratio correlated only 0.44 and 0.62 with the technician's. In 613 Thai adults, self-measured waist and waist-to-height ratio agreed well with trained staff but the ratio didn't: "Self-reported measurements should not be used to derive the WHR" (the waist-to-hip ratio). In a study of adolescents, trained measurers' waist and hip readings differed by about 1.2 to 1.6 cm.

Sources 1, 10, 11

Other populationsEmerging evidence

WHO's consultation noted studies suggesting lower cut-offs for Asian populations, such as 0.90 for men and 0.80 for women, cut-offs like Europe's in the Middle East, and no African studies of the ratio. It recommended no population-specific values: "Only in populations of Asian descent were differences in risk sufficient to warrant consideration of alternative cut-off points". No UK guideline sets waist-to-hip cut-offs: NICE uses the waist-to-height ratio, with the same bands for everyone.

Sources 1, 2

Weight change, age and life stagesEmerging evidence

With a 4.5 kg weight gain, men's waists grew 4 cm and their hips 2.5 cm, but women's waists 3.3 cm and hips 3.6 cm, so weight change moves men's ratios more. The ratio predicts better in young and middle-aged adults than in older people. A year of gender-affirming hormones lowered the ratio by 0.03 in trans women and raised it by 0.01 in trans men.

Sources 1, 20
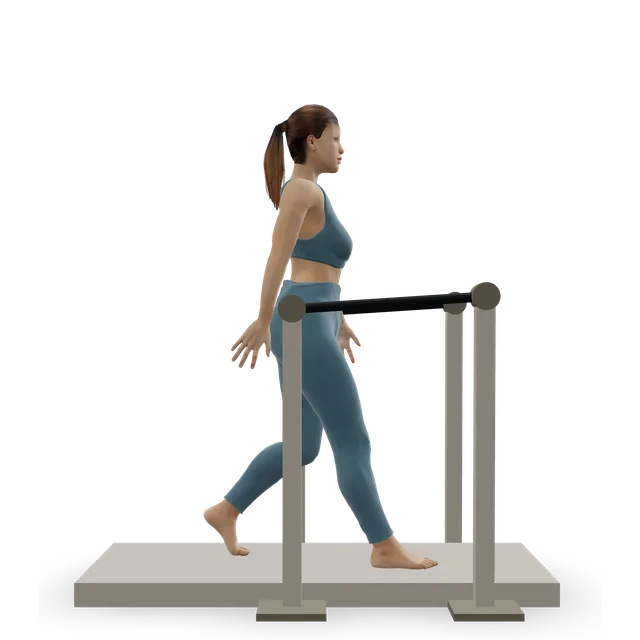
How to measure your waist and hips

WHO's method, with NICE's and the NHS's words for the waist. Use a tape measure that doesn't stretch.

  1. Stand up straight with your feet close together, your arms by your sides and your weight on both feet. Measure against your skin or thin clothing.
  2. Find the bottom of your ribs and the top of your hip bone at your side. Your waist is halfway between them, usually just above your belly button.
  3. Breathe out normally, without holding your tummy in, and wrap the tape around your waist, level, snug but not tight. Read it at the end of the breath out.
  4. For your hips, wrap the tape around the widest part of your bottom, keeping it level with the floor.
  5. Measure each twice. If the two are within 1 cm, use the average; if not, measure twice more.
  6. Divide your waist by your hips, in the same units, or enter both in the calculator.

Waist-to-hip or waist-to-height?

For a quick check, the waist-to-height ratio

NICE uses the waist-to-height ratio for adults with a BMI under 35, with a simple message: keep your waist to less than half your height. It needs one tape measurement and has one cut-off for everyone, so it's the easier check to repeat (our reading).

Sources 2, 19

What the waist-to-hip ratio adds

It reflects your hips as well as your waist. In UK women it was a little more closely linked with heart attacks than the waist-to-height ratio. Bigger hips went with lower risk once BMI was allowed for, an odds ratio of 0.73 in INTERHEART, so a ratio can fall because your hips are bigger rather than your waist smaller (our reading).

Sources 4, 5, 6

Neither replaces a health check

For your own heart and diabetes risk, a check of your blood pressure, cholesterol and blood sugar tells you far more than either ratio. NICE suggests that adults with an increased waist-to-height ratio "seek advice and further clinical assessments (such as a cardiometabolic risk factor assessment) from a healthcare professional".

Sources 2, 9

To see change, track your waist

A woman's waist and hips change together as she gains or loses weight, so her ratio can stay much the same. Your waist measurement, or your waist-to-height ratio, shows the change better.

Source 1

Who it isn't for

Under 18

The calculator stops. No guideline we found sets waist-to-hip cut-offs for children. NICE uses the waist-to-height ratio from age 5, and the NHS calculator for 5 to 17-year-olds is used with a parent or carer after checking BMI.

Sources 2, 13

During pregnancy, and after it

The calculator stops in pregnancy: your waist and hips change, and WHO's report notes that pregnancy is "associated with gains in visceral and central adiposity postpartum". After birth, give your body time; your midwife or health visitor can talk to you about your weight.

Source 1

If you have, or have had, an eating disorder

These numbers aren't the right tool. The calculator shows where to get help under every result, and the support section below has the numbers.

Sources 21, 22

A BMI of 35 or more

The ratio still works, but NICE doesn't use the waist-to-height ratio at this BMI, so the calculator leaves that line out.

Source 2

Lipoedema

In lipoedema, fat builds up in "your bottom, thighs, lower legs", with "a narrow waist" in the early stages, so the ratio can read low. The waist-to-height ratio is a better guide.

Source 23

Fluid in your tummy, a stoma, a large hernia or recent surgery

Your waist measurement won't reflect fat, so the ratio won't either. Ask your care team instead.

Taking gender-affirming hormones

WHO's cut-offs were set for women and men, and the ratio moves with treatment. Choose "Show both" to see both cut-offs; your clinic can advise which applies.

Sources 1, 20

If you can't stand to be measured

WHO's method is standing, and NICE notes "challenges in using BMI or waist-to-height ratio in people who have a physical disability, some physical conditions (such as scoliosis)". Ask a health professional how to adapt the measurements.

Sources 1, 19

65 and over

WHO's report notes the ratio is "strongly predictive in young and middle-aged adults compared to older people and those with low BMI", so the calculator adds a note from 65.

Source 1

Common myths

"WHO says under 0.80 (women) or 0.95 (men) is low risk"Strong evidence

Some calculator sites print low, moderate and high bands and credit them to WHO, but WHO's report has one cut-off for each sex, at which risk is substantially increased, and no lower bands.

Source 1

"The ideal waist-to-hip ratio for women is 0.7"Strong evidence

Preferences for a low ratio come from studies in which men rated how attractive drawings of women were. Health guidance uses 0.85 for women, risk rises steadily with the ratio, and no health body names 0.7.

Sources 1, 6, 12

"It's the best measure of belly fat risk"Mixed evidence

It was a little stronger than the waist-to-height ratio for heart attacks in UK women but weaker for future diabetes, NICE found the measures similarly accurate, none of them helps a heart risk check much, and the ratio is the hardest to measure well.

Sources 5, 7, 8, 9

"Bigger hips are a health risk"Strong evidence

Larger hips went with lower risk once BMI was allowed for, in INTERHEART and across cohort studies, where each 10 cm more hip went with 10% lower mortality.

Sources 4, 6

"Measure your waist at its narrowest point or at your belly button"Strong evidence

WHO's cut-offs go with the midpoint between your lowest rib and the top of your hip bone, the site NICE uses. Other sites give a different number, though they rank people's risk in much the same way.

Sources 1, 2

"Losing weight always improves your ratio"Emerging evidence

In women the waist and hips changed by about the same amount with weight change, so the ratio barely moved. Your waist, or your waist-to-height ratio, shows the change better.

Source 1

"Your waist-to-hip ratio tells you your body fat"Strong evidence

It shows where fat sits, "both subcutaneous and intra-abdominal adipose tissue", not how much there is. Our body fat calculator estimates the percentage.

Source 1

If you're worried about your weight or eating

Eating disorders

If you have, or think you might have, an eating disorder, these numbers aren't the right tool. See a GP as soon as you can, or talk in confidence to the eating disorder charity Beat: 0808 801 0677 (England), 0808 801 0432 (Scotland), 0808 801 0433 (Wales) or 0808 801 0434 (Northern Ireland). Beat's helplines are open 3pm to 8pm, Monday to Friday, and it also offers web chat and email. If you or someone else is in immediate danger, call 999 or Samaritans on 116 123; for medical advice, contact your GP or call 111.

Sources 21, 22

Warning signs

The NHS lists signs such as spending a lot of time worrying about your weight and body shape, eating very little food, exercising too much, and having very strict habits or routines around food.

Source 21

If measuring yourself upsets you

If you check or measure your body often in a way that upsets you, a GP can help. You can also refer yourself to NHS talking therapies for difficult feelings such as worry or low mood, if you're 18 or over (16 in some areas) and registered with a GP.

Source 24

A check of your heart and diabetes risk

If your ratio is at or above the cut-off, or you're worried about your heart or diabetes risk, ask your GP practice about checking your blood pressure, cholesterol and blood sugar (our suggestion). NICE suggests this kind of check for an increased waist-to-height ratio.

Sources 2, 9

Goals that aren't numbers

If numbers like these make you anxious, set goals for health and strength instead, such as walking further or lifting a little more (our suggestion, as in our exercise for weight loss guide).

Workouts to try

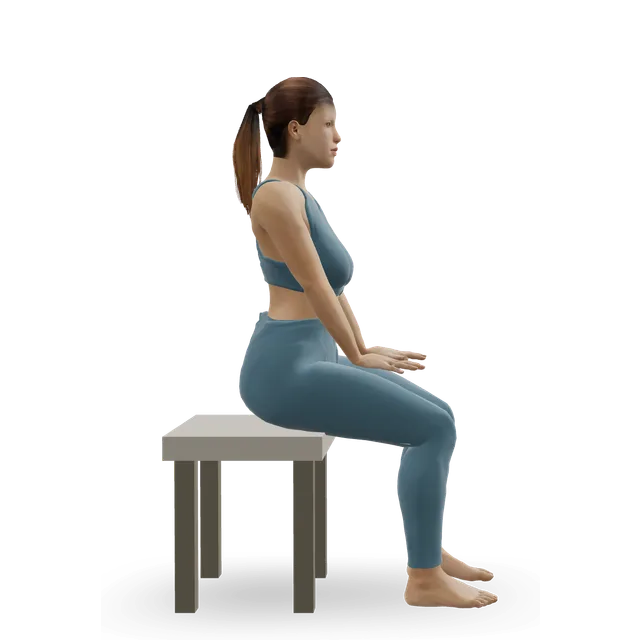
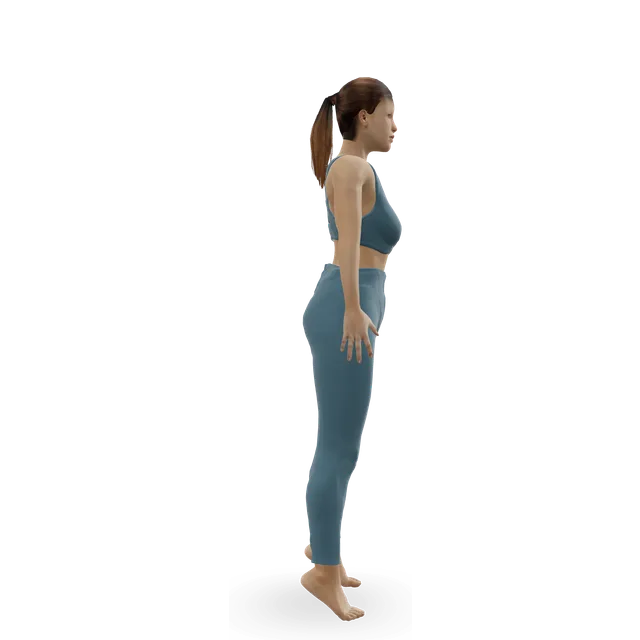
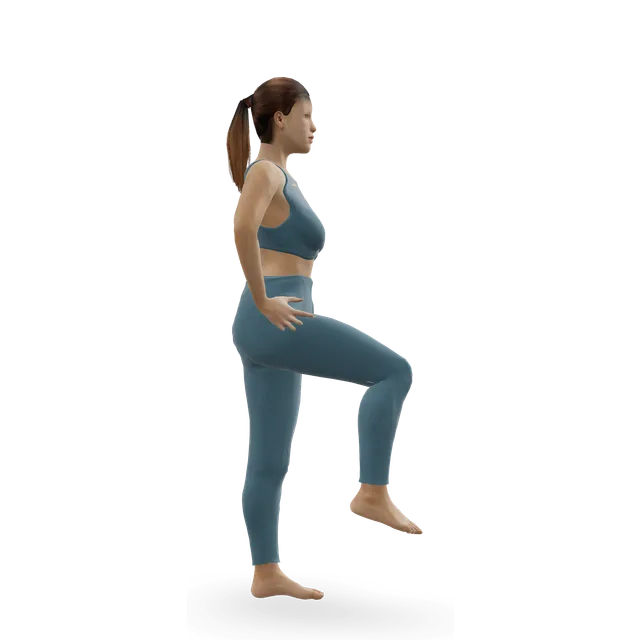
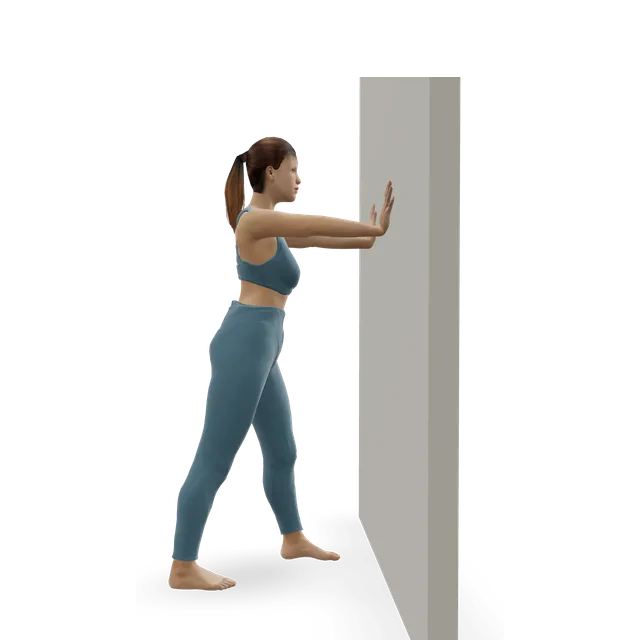
Whole-body activity, not exercises for your stomach, trims the waist. These mix walking and steady cardio with strength work, and the low-impact circuit has no jumping.

Questions people ask

What is a healthy waist-to-hip ratio?

WHO counts a ratio of 0.90 or more for men, or 0.85 or more for women, as a substantially increased risk of metabolic complications such as type 2 diabetes. WHO gives no healthy band below that, and risk rises gradually with the ratio rather than jumping at a line. In the UK, NICE uses the waist-to-height ratio instead: keep your waist to less than half your height.

How do I measure my waist-to-hip ratio?

Stand with your feet together and breathe out normally. Measure your waist halfway between your lowest rib and the top of your hip bone, and your hips around the widest part of your bottom, with the tape level and snug but not tight. Measure each twice, use the average if they're within 1 cm, and divide your waist by your hips.

What's a good waist-to-hip ratio for a woman?

Below 0.85 is below WHO's cut-off for women, but WHO doesn't call any range healthy. A woman's ratio can stay much the same as her weight changes, because her waist and hips change together, so your waist itself or your waist-to-height ratio shows change better. The "ideal" 0.7 you may see comes from studies of attractiveness, not health.

What's a good waist-to-hip ratio for a man?

Below 0.90 is below WHO's cut-off for men. Men tend to carry more of their fat around the middle, and their waists grow more than their hips as they gain weight, so the ratio moves more with weight in men than in women.

Is waist-to-hip ratio better than BMI?

In big studies it tracked heart attack risk more closely than BMI: in INTERHEART, the highest ratios accounted for about a quarter of heart attacks, against under a tenth for the highest BMIs. But for one person, neither adds much to a check of your blood pressure, cholesterol and blood sugar.

Is waist-to-hip or waist-to-height ratio better?

They're similar overall. The waist-to-hip ratio was a little stronger for heart attacks in women in UK Biobank, and the waist-to-height ratio stronger for future diabetes. NICE found them similarly accurate and chose waist-to-height because it needs one tape measurement and has one cut-off for everyone.

Why doesn't the NHS use waist-to-hip ratio?

NICE, which sets the guidance the NHS follows, found the measures similarly accurate and chose the waist-to-height ratio. Your height is usually measured already, it needs only your waist, its cut-off is the same for both sexes and all ethnic backgrounds, and keeping your waist to less than half your height is easy to remember. WHO also favours waist measures, because hips are harder to measure.

Are the cut-offs different for different ethnic backgrounds?

WHO's 2008 consultation noted studies suggesting lower cut-offs for Asian populations, such as 0.90 for men and 0.80 for women, but didn't recommend them, and no UK guideline sets any. NICE's waist-to-height ratio uses the same bands for everyone.

How can I lower my waist-to-hip ratio?

Whole-body activity and eating less trim the waist; exercising your stomach muscles doesn't burn the fat over them, as our exercise for weight loss guide explains. Because your hips can shrink too, especially in women, track your waist or waist-to-height ratio as well as the ratio.

Why does my ratio change every time I measure?

Small differences in where the tape sits make a big difference: even trained measurers differ by about 1.2 to 1.6 cm, and people measuring themselves tend to read their waist a little small. With hips of 100 cm, a 1.5 cm difference in the waist changes the ratio by 0.015, so measure twice, at the same time of day, and use the average.

Sources

  1. WHO 2011 · Waist circumference and waist-hip ratio: report of a WHO expert consultation, Geneva, 2008
  2. NICE NG246 · Identifying and assessing overweight, obesity and central adiposity, including the waist-to-height ratio and how to measure the waist
  3. WHO 1999 · Definition, diagnosis and classification of diabetes mellitus and its complications, part 1, with a working definition of the metabolic syndrome (report of a WHO consultation)
  4. Yusuf 2005 · Obesity and the risk of heart attack in 27,098 people in 52 countries: INTERHEART (case-control study, Lancet)
  5. Peters 2018 · Sex differences in body measures and heart attack risk in 479,610 adults: UK Biobank (cohort study, J Am Heart Assoc)
  6. Jayedi 2020 · Central fatness and all-cause mortality: 72 cohort studies (dose-response meta-analysis, BMJ)
  7. Kodama 2012 · Waist-to-height ratio, waist, BMI and waist-to-hip ratio and future type 2 diabetes: 15 studies (meta-analysis, Am J Epidemiol)
  8. NICE 2022 · Evidence review A: accuracy of body measures in assessing health risks of overweight and obesity in adults (for CG189, now behind NG246)
  9. Emerging Risk Factors Collaboration 2011 · BMI, waist and waist-to-hip ratio and cardiovascular disease: 58 studies, 221,934 people (individual-participant analysis, Lancet)
  10. Spencer 2004 · Accuracy of self-reported waist and hip measurements in 4,492 EPIC-Oxford participants (study, Public Health Nutr)
  11. Lim 2012 · Self-reported waist, waist-to-hip and waist-to-height ratios in 613 Thai adults (validation study, Nutr Metab Cardiovasc Dis)
  12. Singh 1993 · Waist-to-hip ratio and judgements of female attractiveness (psychology studies, J Pers Soc Psychol)
  13. NHS · Calculate your waist to height ratio, and how to measure your waist
  14. Emdin 2017 · Genes for a higher waist-to-hip ratio, type 2 diabetes and coronary heart disease (Mendelian randomisation study, JAMA)
  15. de Koning 2007 · Waist and waist-to-hip ratio and cardiovascular events: 15 studies, 258,114 people (meta-regression, Eur Heart J)
  16. Czernichow 2011 · BMI, waist and waist-hip ratio and cardiovascular death in 82,864 people in nine British cohorts (individual-participant meta-analysis, Obes Rev)
  17. Pischon 2008 · General and abdominal fat and the risk of death in 359,387 Europeans: EPIC (cohort study, N Engl J Med)
  18. Lee 2008 · Measures of abdominal obesity against BMI for picking out heart risk factors: 10 studies (meta-analysis, J Clin Epidemiol)
  19. NICE NG246 · Rationale and impact: why the committee chose the waist-to-height ratio
  20. Klaver 2018 · Body fat, lean mass and body shape in trans people in their first year of hormone treatment (cohort study, Eur J Endocrinol)
  21. NHS · Eating disorders: overview
  22. Beat · Helplines and support
  23. NHS · Lipoedema
  24. NHS · Talking therapies, including referring yourself

Estimates for healthy adults, not a personal prescription or a diagnosis, and clinical review of these pages is pending. Check with a GP before hard training or testing a maximum if you have a heart condition, high blood pressure, chest pain, dizziness or breathlessness when active, and stop for sharp or increasing pain. Health disclaimer.